Denver, Colorado
/
/
Precipitation in California: 1950 to 2014

Precipitation in California Over Time - 1950 to 2014

Visualizing Climate Change

This time series required the acquisition of 61 years of precipitation data for every gauge in California. Microsoft Access was used to manage the massive data set. I excluded any gauges from the analysis that were not present for the entire 20 year span of any time series. The 20-year average was then calculate for each gauge, converted into a geospatial database, and used to create point files. After the point files were interpolated in ArcMap (Kriging interpolation), Adobe Photoshop was used for coloring and Illustrator for layout and overall design.

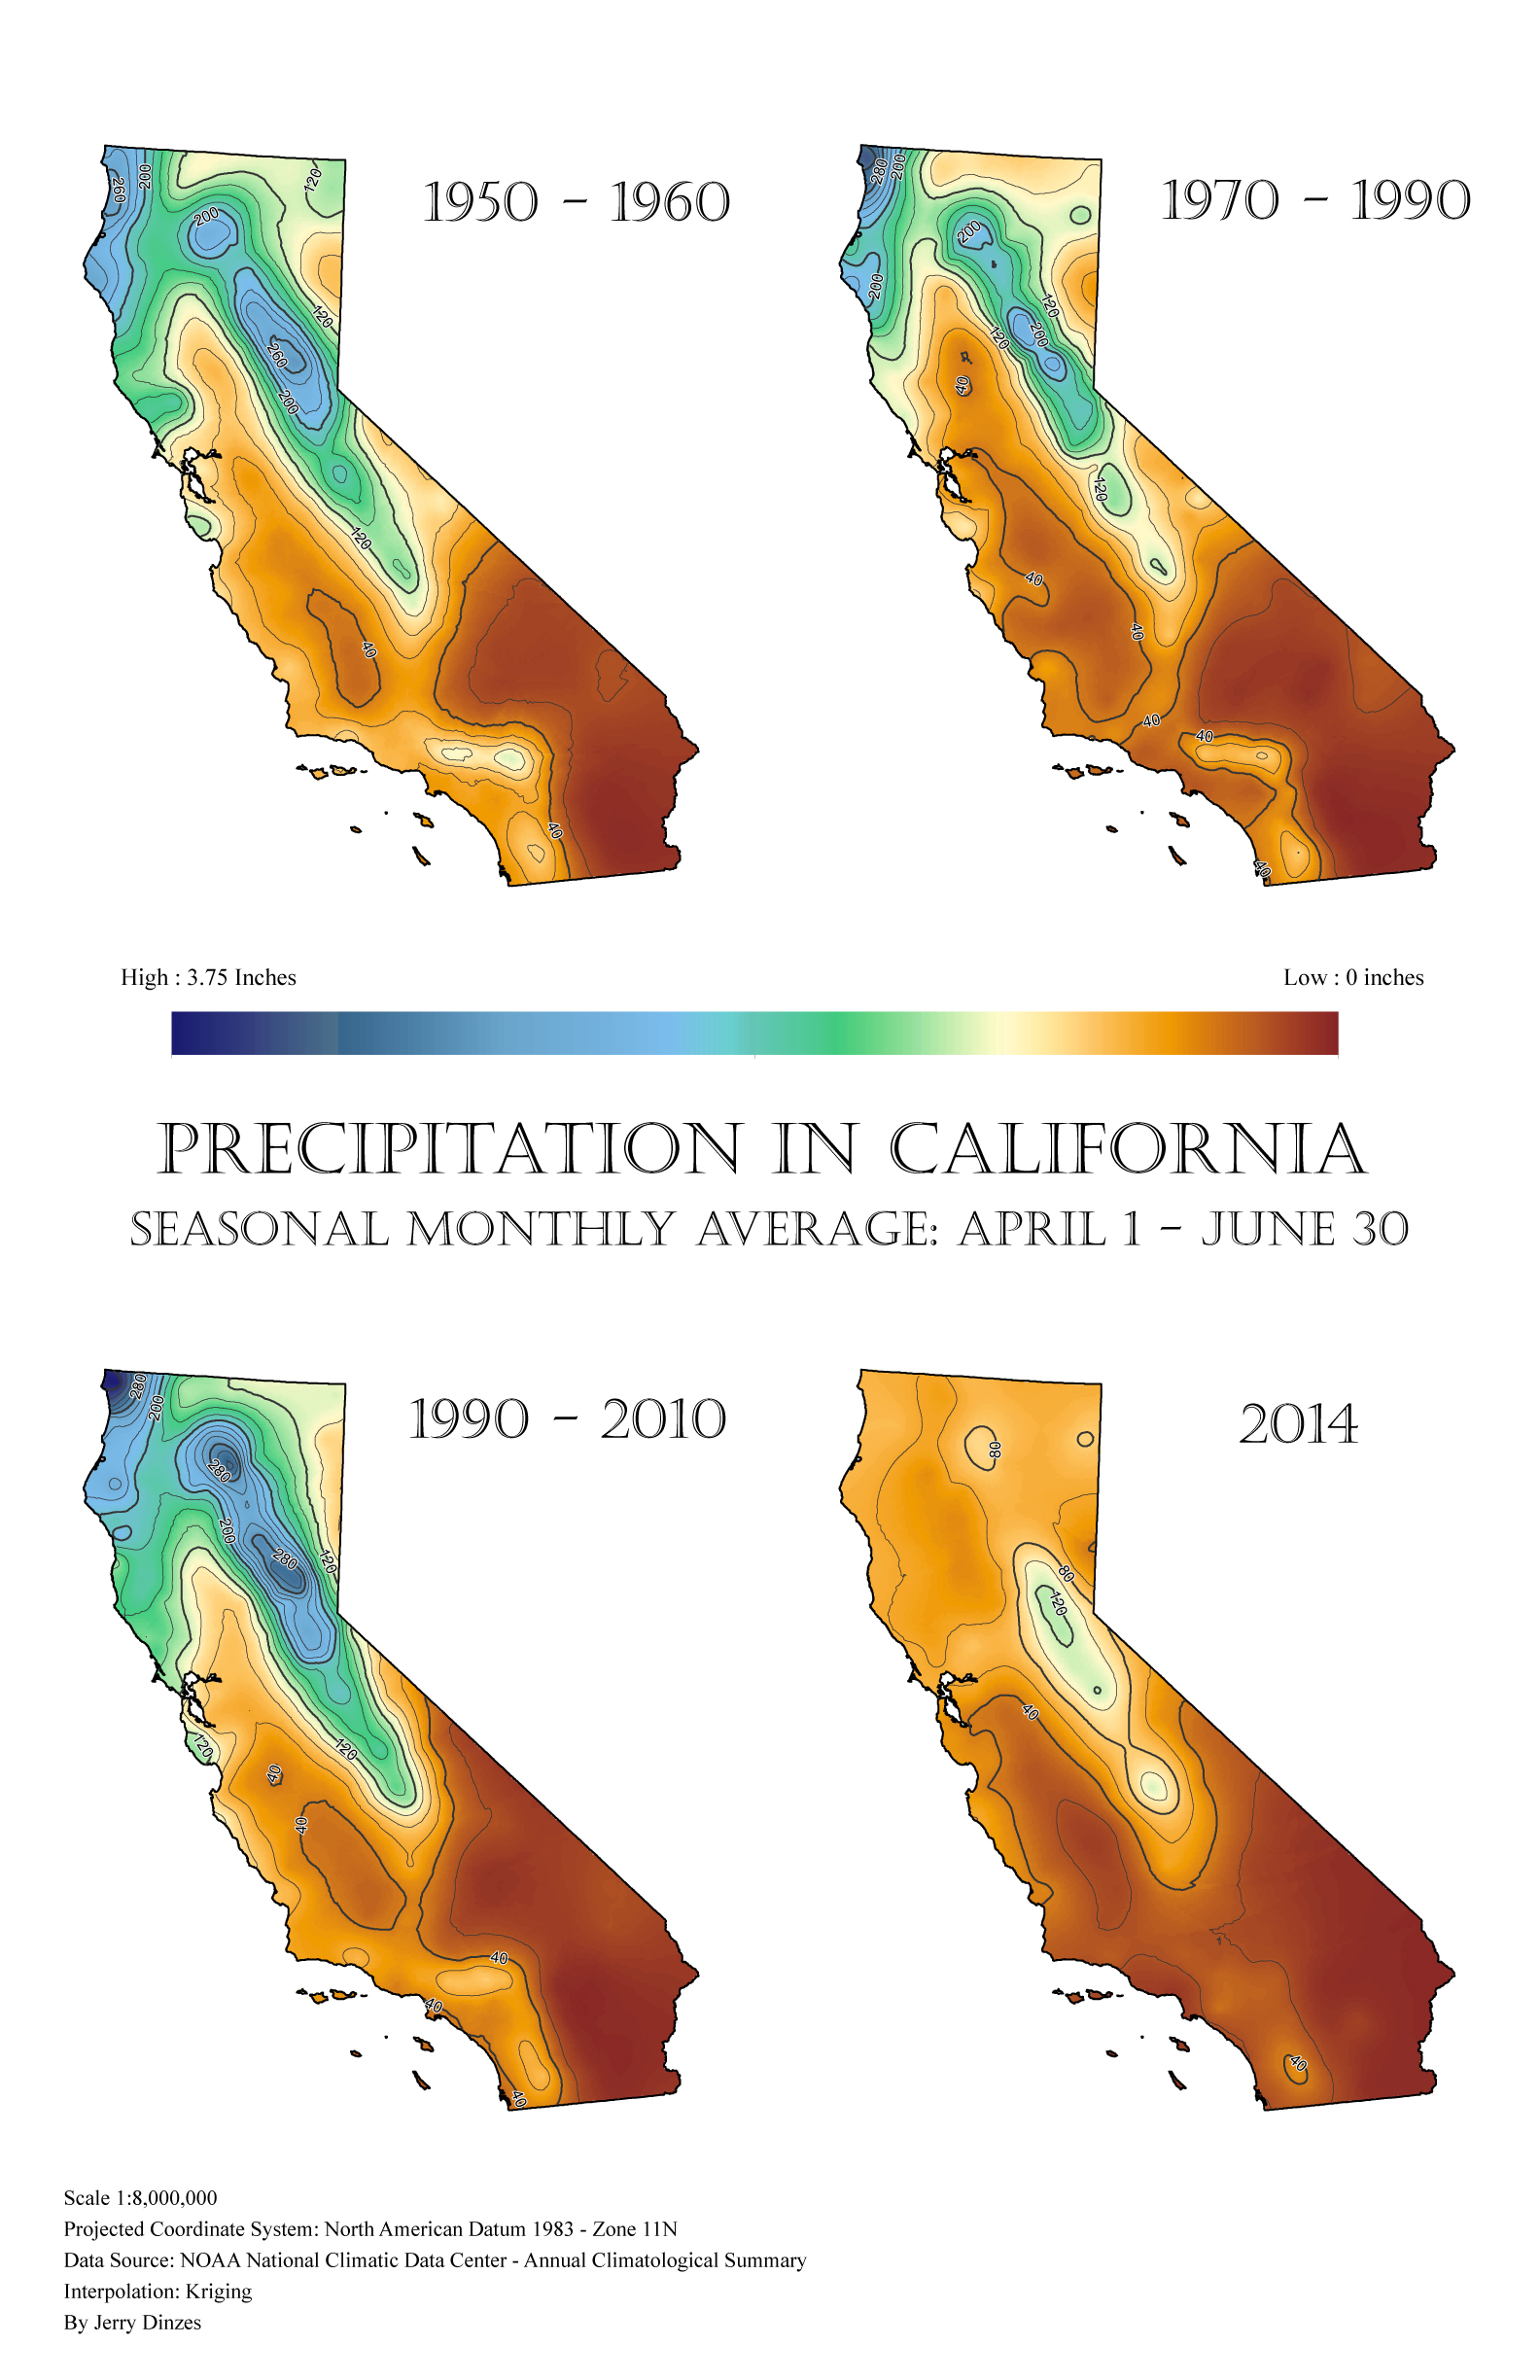
Note: The first map in this series is incorrectly labeled, and should read “1950-1970″ (though”1950-1969” is more accurate).

Visualizing Climate Change in California by Jerry Dinzes

Advanced Cartographic Seminar (2015)

Maps by Jerry Dinzes

Related Maps

Impervious Surface at Lake Tahoe

I mapped impervious surfaces in alarming colors to call attention to one of the environmental challenges that land planners face…

Mad River Bridge Compensatory Wetland Study

In 2014, our team conducted a wetland delineation to gauge the success of a compensatory wetland project. We selected this particular project…

Redwood Creek Watershed Delineation

The political lines are generally drawn without much consideration of the watershed's boundaries, making watershed management a multigovernmental task.

More Maps by Jerry Dinzes

© 2019 – The Official Website for Jerry Dinzes.