

The area where residential development is located proximate to wildland vegetation is known as the wildland-urban interface (WUI).2Volker C. Radeloff et al., Rapid Growth of the US Wildland-Urban Interface Raises Wildfire Risk, 115 PNAS 3314 (2018); Travis B. Paveglio et al., Understanding Social Complexity Within the Wildland–Urban Interface: A New Species of Human Habitation?, 43 Env’t Mgmt. 1085 (2009); Volker C. Radeloff et al., The Wildland-Urban Interface in the United States, 15 Ecological Application 799 (2005). Between 1990 and 2010, the WUI was the fastest growing land type in the contiguous United States, with the land area growing by 33% and the number of homes in the WUI growing by 41%.3Volker C. Radeloff et al., Rapid Growth of the US Wildland-Urban Interface Raises Wildfire Risk, 115 PNAS 3314 (2018). This growth was primarily driven by residential development.4Volker C. Radeloff et al., Rapid Growth of the US Wildland-Urban Interface Raises Wildfire Risk, 115 PNAS 3314 (2018).
This increasing conversion of wildland habitat into residential land use has resulted in habitat fragmentation, greater competition for resources among wildlife species, decreased biodiversity, and increased frequency in human-wildlife interactions within WUI’s.5 Stephen DeStefano & Richard M DeGraff, Exploring the Ecology of Suburban Wildlife, 1 Frontiers Ecology & Env’t 95 (2003); Michael L. McKinnley, Urbanization as a Major Cause of Biotic Homogenization, 127 Biological Conservation 247 (2006); Avi Bar-Massada et al., Biotic and Abiotic Effects of Human Settlements in the Wildland–Urban Interface, 64 BioScience 429 (2014). Scientists widely acknowledge the impact of human ecology on species diversity and behavior, but many advocate that further research must be done in order to better understand urban wildlife ecology.6 Stephen DeStefano & Richard M DeGraff, Exploring the Ecology of Suburban Wildlife, 1 Frontiers Ecology & Env’t 95 (2003); Michael L. McKinnley, Urbanization as a Major Cause of Biotic Homogenization, 127 Biological Conservation 247 (2006). Currently, most WUI research is within the context of improving fire management strategies, although the growing focus on social complexity within the WUI is applicable to the management of other resources.7 Susan I. Stewart et al., Defining the Wildland–Urban Interface, 105 J. Forestry 201 (2007); Travis B. Paveglio et al., Understanding Social Complexity Within the Wildland–Urban Interface: A New Species of Human Habitation?, 43 Env’t Mgmt. 1085 (2009); Brice B. Hanberry, Reclassifying the Wildland–Urban Interface Using Fire Occurrences for the United States, 9 Land 225 (2020).
Research has shown that factors such as education, income, ethnicity, and gender may impact urban biodiversity and differentiate community members’ perceptions of urban wildlife.8Ann P. Kinzig et al., The Effects of Human Socioeconomic Status and Cultural Characteristics on Urban Patterns of Biodiversity, 10 Ecology & Soc. 23 (2005). Income is generally regarded as the primary driver of a community’s relationship to species biodiversity, whether vegetative, avian, or mammalian. 9Chris A. Martin, Neighborhood Socioeconomic Status is a Useful Predictor of Perennial Landscape Vegetation in Residential Neighborhoods and Embedded Small Parks of Phoenix, AZ, 69 Landscape & Urb. Plan. 255 (2004); Larissa Larsen & Sharon L. Harlan, Desert Dreamscapes: Residential Landscape Preference and Behavior, 78 Landscape & Urb. Plan. 85 (2006); Paige S. Warren et al., Making Sense of the City: Human Socioeconomic Status Predicts Avian Community Structure in Urban Parks, 3 Urb. Habitat 1541 (2003). Although previous research shows that both education and ethnicity correlate with urban biodiversity richness, both of these factors influence income outcomes. 10 hris A. Martin, Neighborhood Socioeconomic Status is a Useful Predictor of Perennial Landscape Vegetation in Residential Neighborhoods and Embedded Small Parks of Phoenix, AZ, 69 Landscape & Urb. Plan. 255 (2004). One study showed that the amount of residents with bachelor’s degrees in a given area correlated to high avian species diversity near two universities in Britain. 11 Paige S. Warren et al., Making Sense of the City: Human Socioeconomic Status Predicts Avian Community Structure in Urban Parks, 3 Urb. Habitat 1541 (2003). Gathering more information about these relationships is crucial. The future of urban conservation will be greatly driven by the scientific understanding of socioeconomic factors that drive conservation perceptions and values.
Our research project is intended to examine the social patterns that may impact wildlife within the WUI. By conducting a door to door survey along an urban gradient, we explored residential relationships to wildlife relative to home ownership, density zoning, education, gender, and membership in a conservation organization.
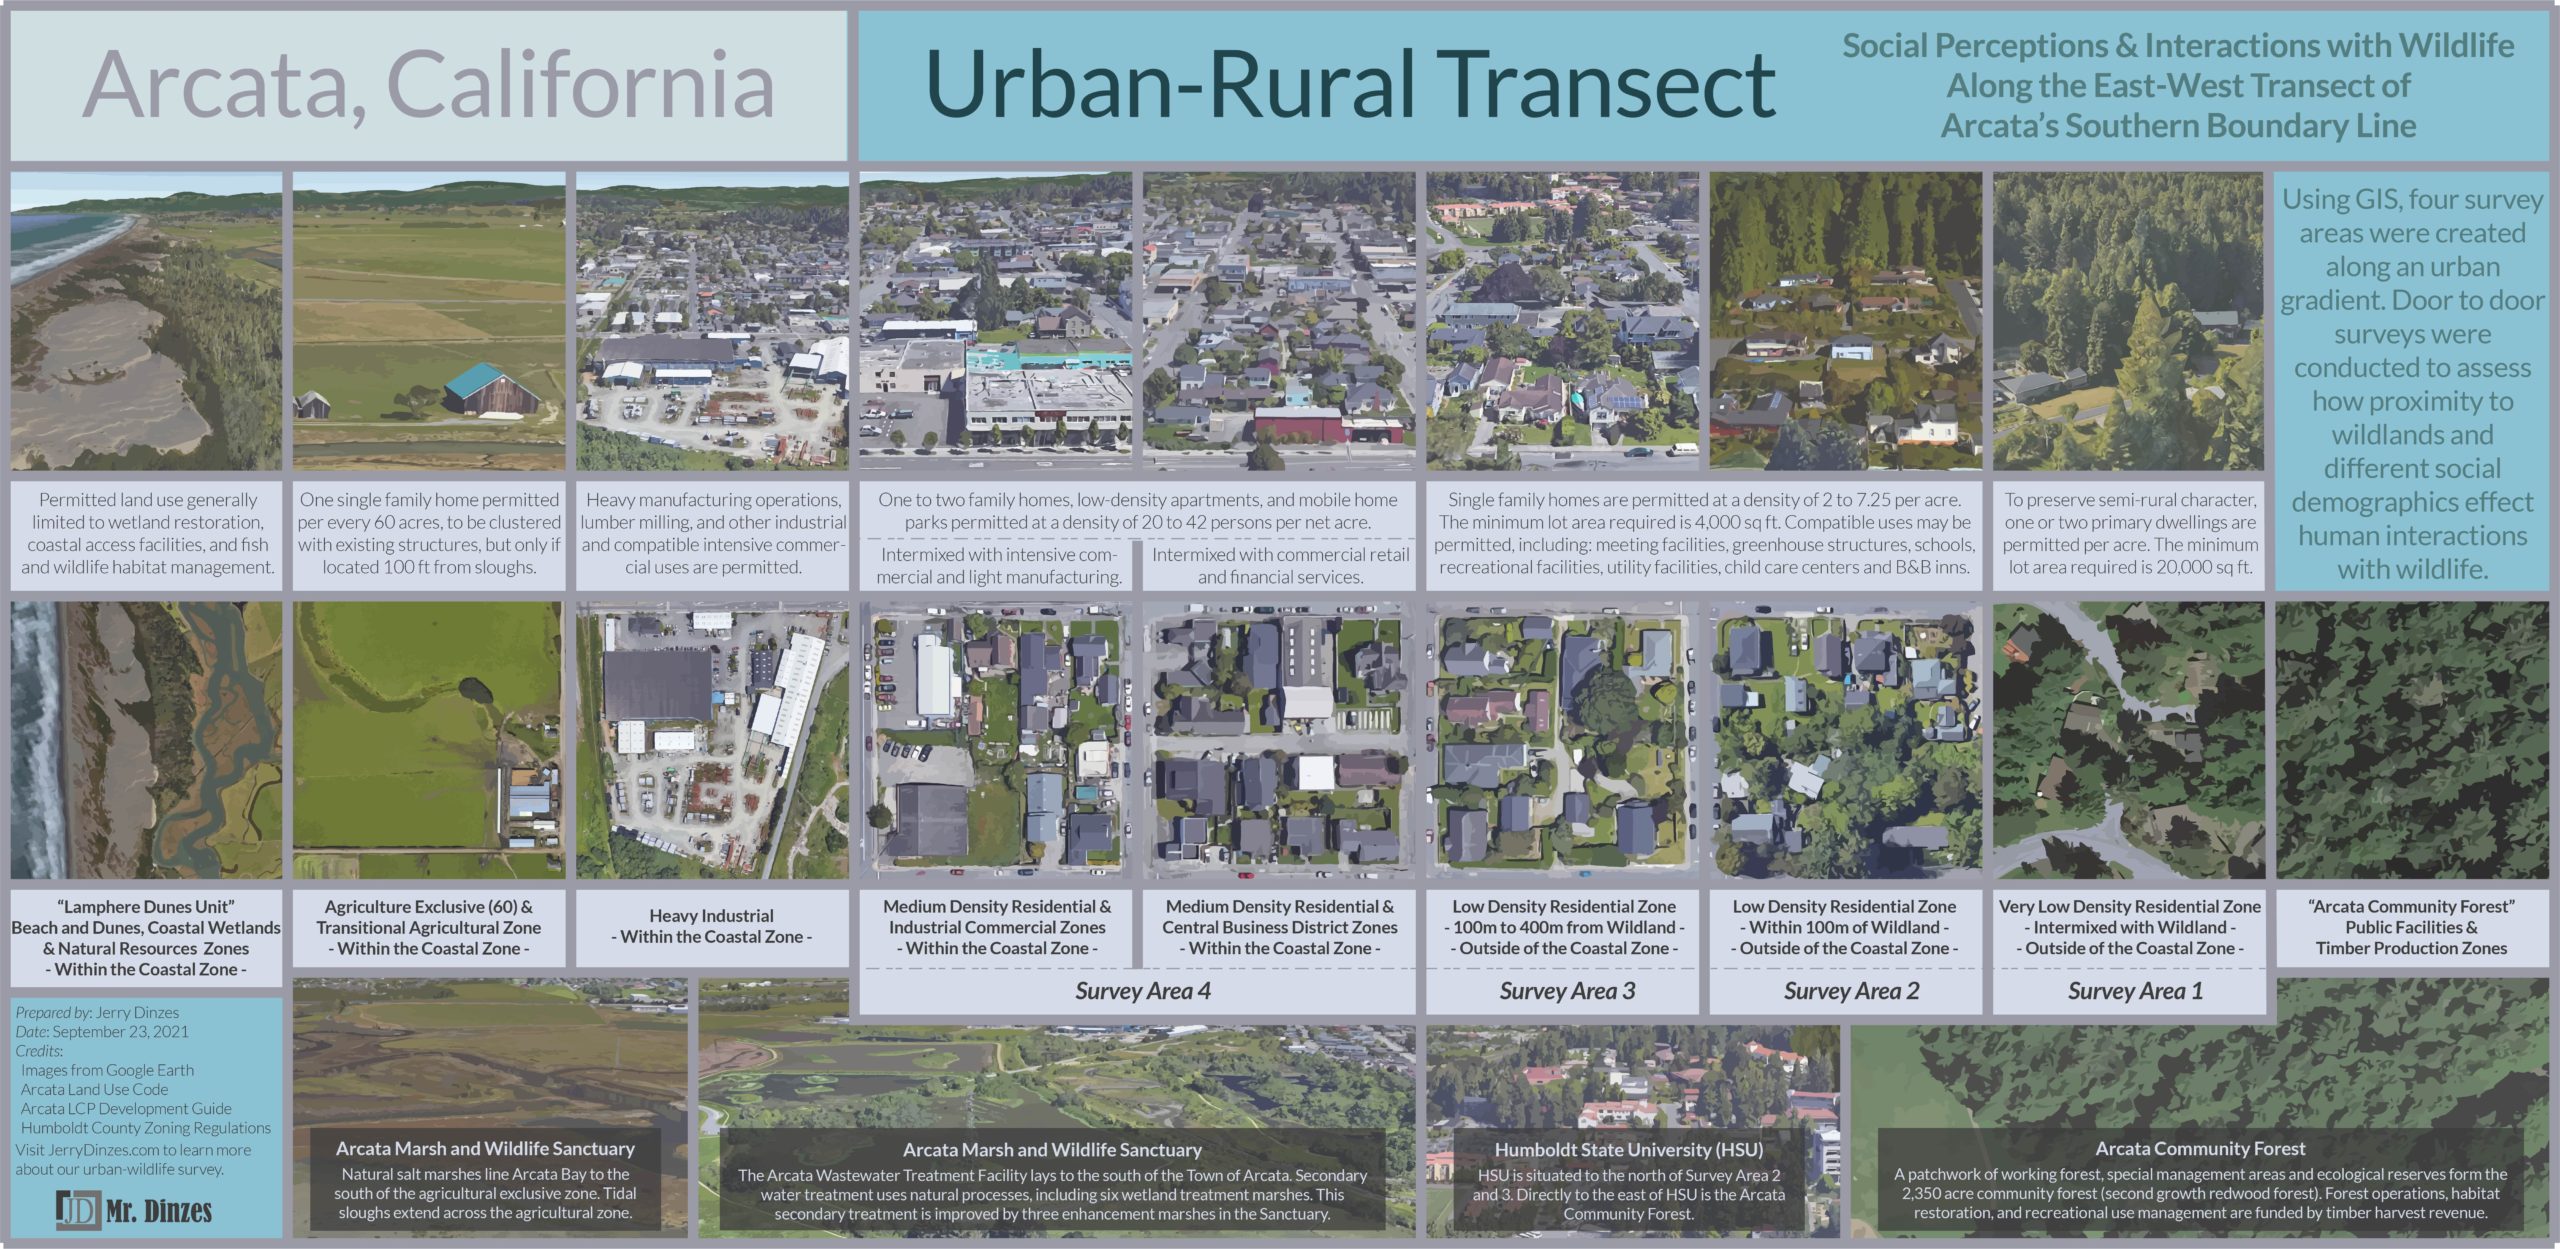
We conducted the study in the city of Arcata (40.9° N, 124.1° W), located in Humboldt County, on California’s northern coastline. California’s north coast is known for its abundance of natural features. Home to abundant riparian zones, redwood forests, and coastal oak forests, this area offers prime wildlife habitat.
Our study area is in the urban-wildland interface of Arcata. To the east of the study area is the Arcata Community Forest, which is located within 800 meters of the furthest reach of our survey area. To the west and south of the study area is the Pacific Ocean, Humboldt Bay, and a plethora of estuarine and dune habitat.
The community has a population of 17,726, which is considered large within the scale of California’s remote north coast (Table 1). The persons per household in Arcata is 2.32, a slightly smaller number than the California average of 2.93 (Table 1). This person per household average does appear to be consistent with other rural communities in the north coast region (Crescent City– 2.40; Eureka– 2.34; Redding– 2.51).12 United States Census Bureau, State and County Quick Facts (2012) Arcata has very little high-density development. Developments are primarily characterized as very low, low and middle density.
Arcata is home to Humboldt State University (HSU). Certain socioeconomic factors relating to income and education are highly influenced by HSU, which has more than 8000 enrolled students. The percentage of Arcata’s citizens living below the poverty rate is 33.7%, which is much higher than California’s 15.3% average (Table 1). Because of HSU’s presence, a very large amount of residents have a bachelor degree or higher, and over 92% are high school graduates (Table 1).
Variable | Arcata | California |
|---|---|---|
Population | 17,726 | 37,999,878 |
High School Degree or Higher | 92.6% | 81.0% |
Bachelor Degree or Higher | 45.6% | 30.5% |
Persons Per Household | 2.3% | 2.9% |
Living in Same House for 1 Year of Greater | 65.0% | 85.0% |
Home Ownership Rate | 35.2% | 56.0% |
Median Household Income | $32,097.00 | $61,400.00 |
Persons Living Below Poverty Rate | 33.7% | 15.3% |
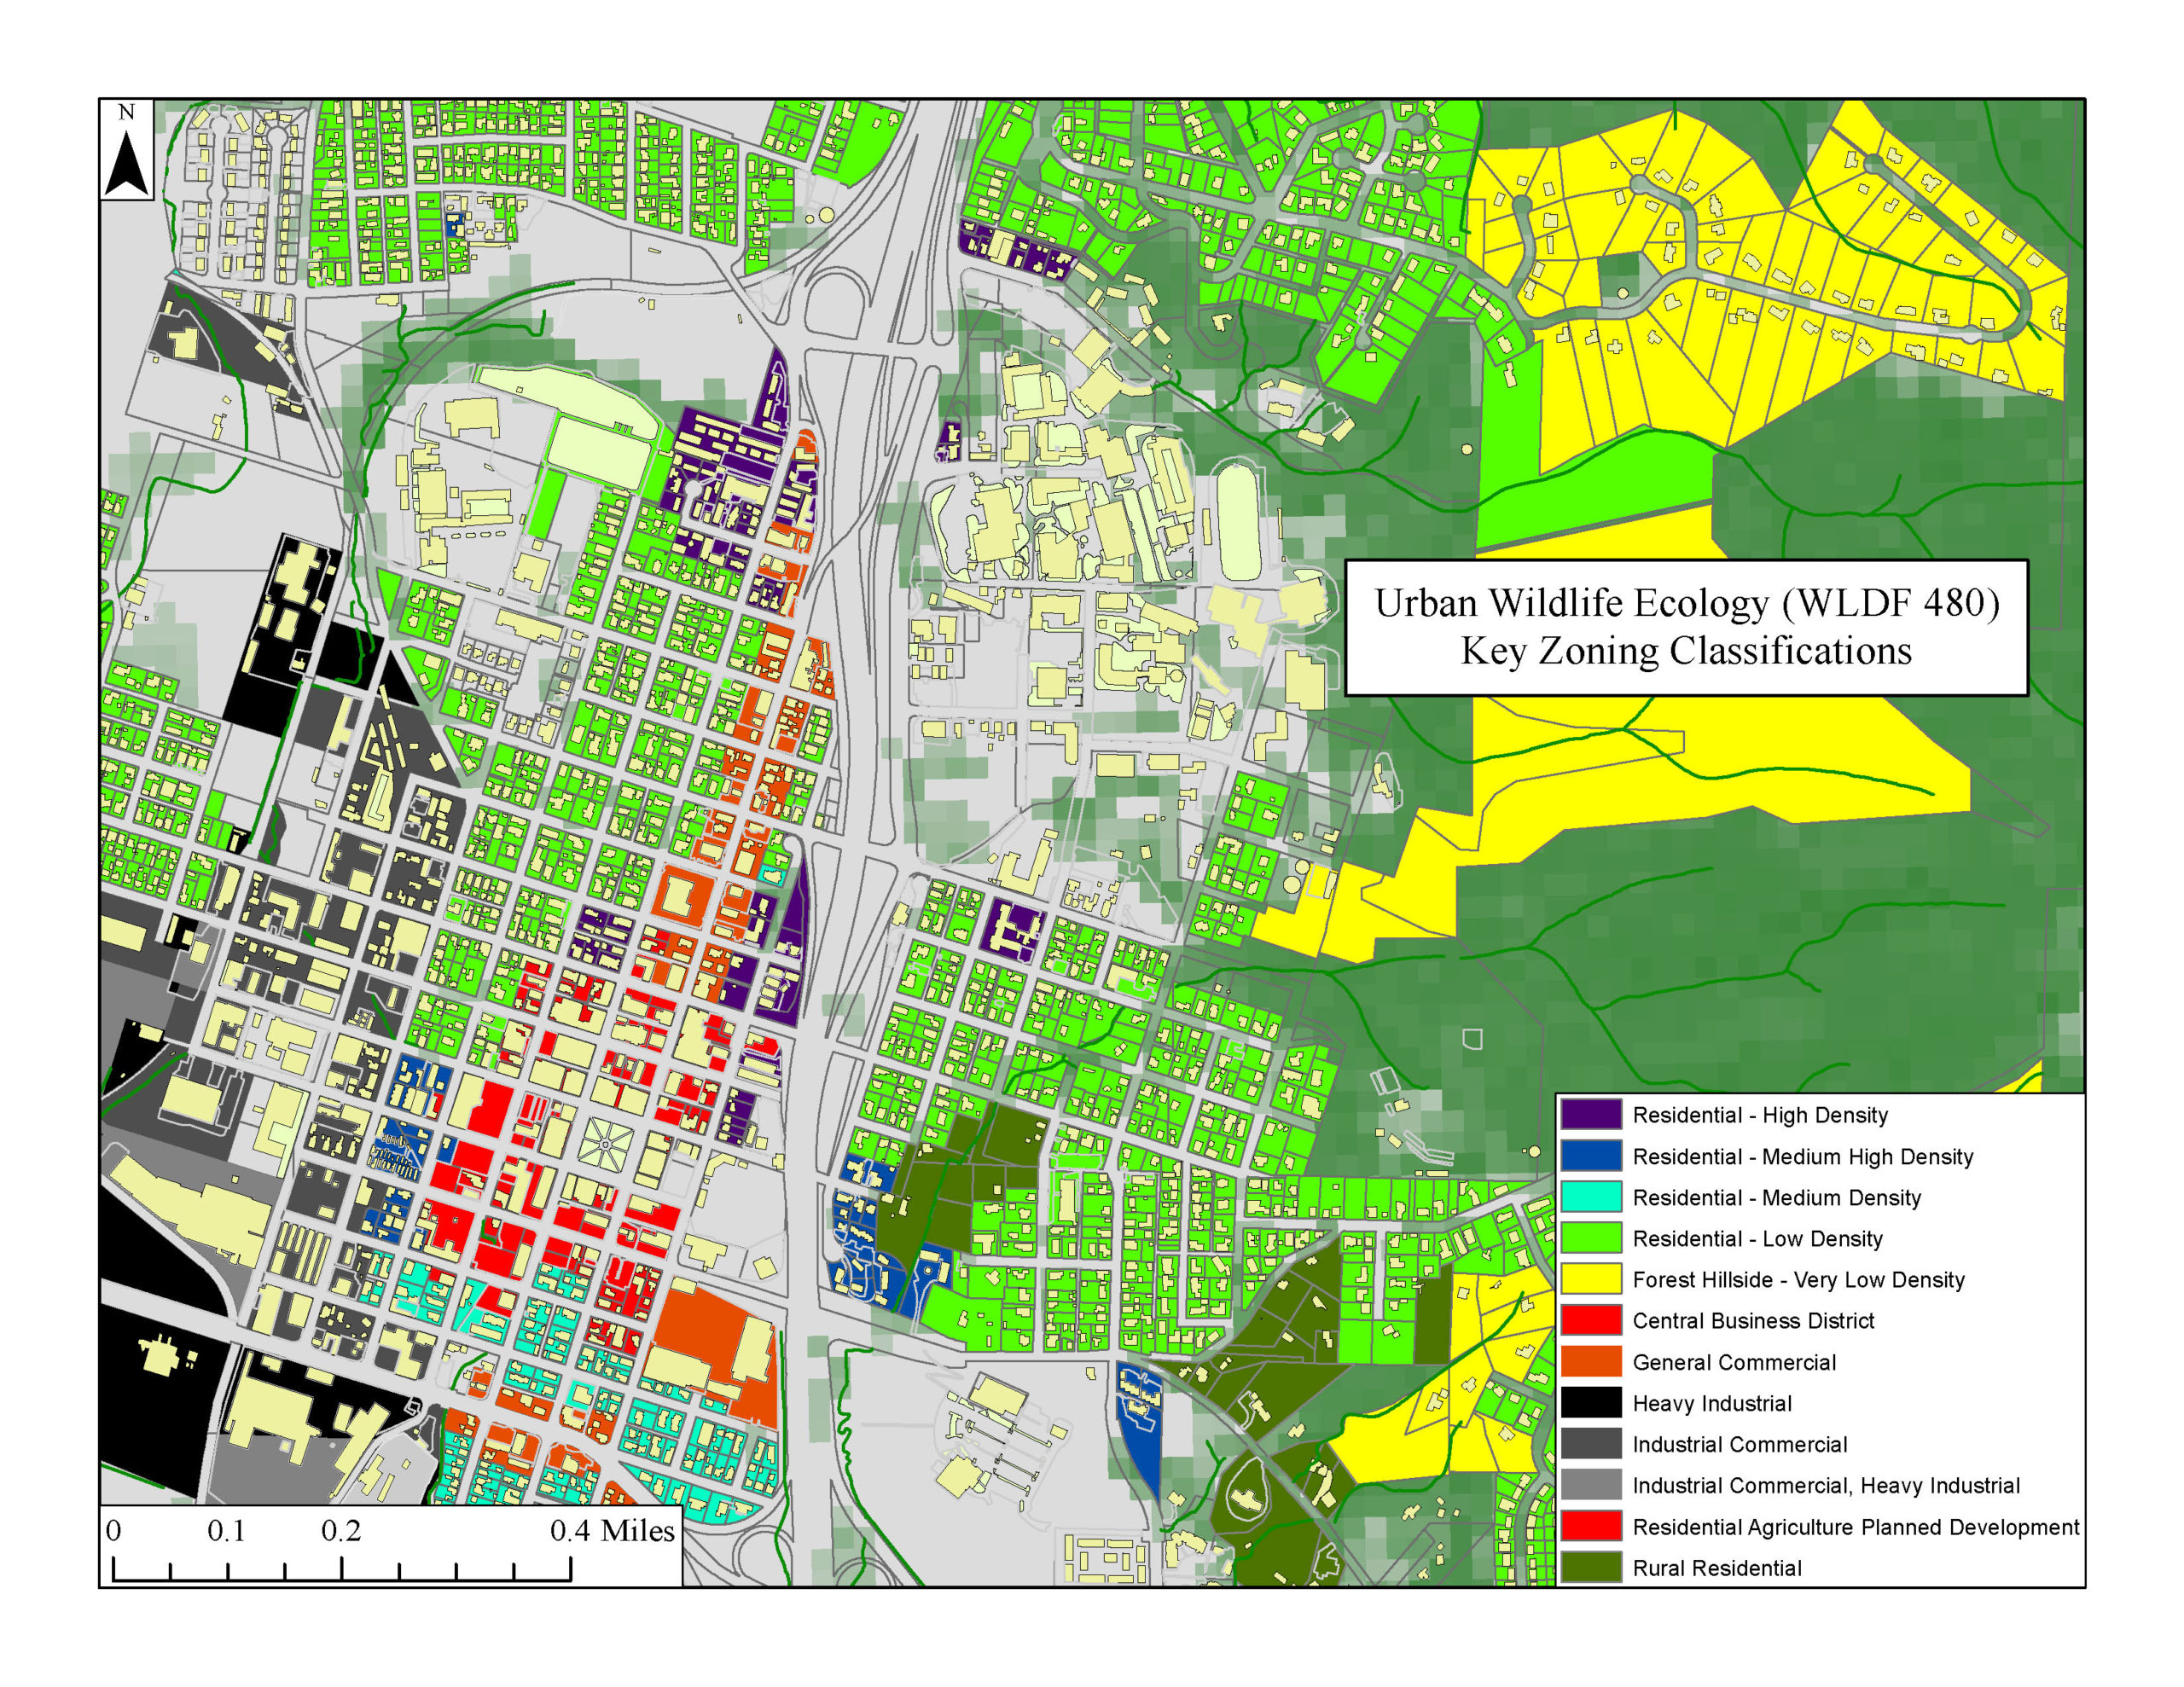
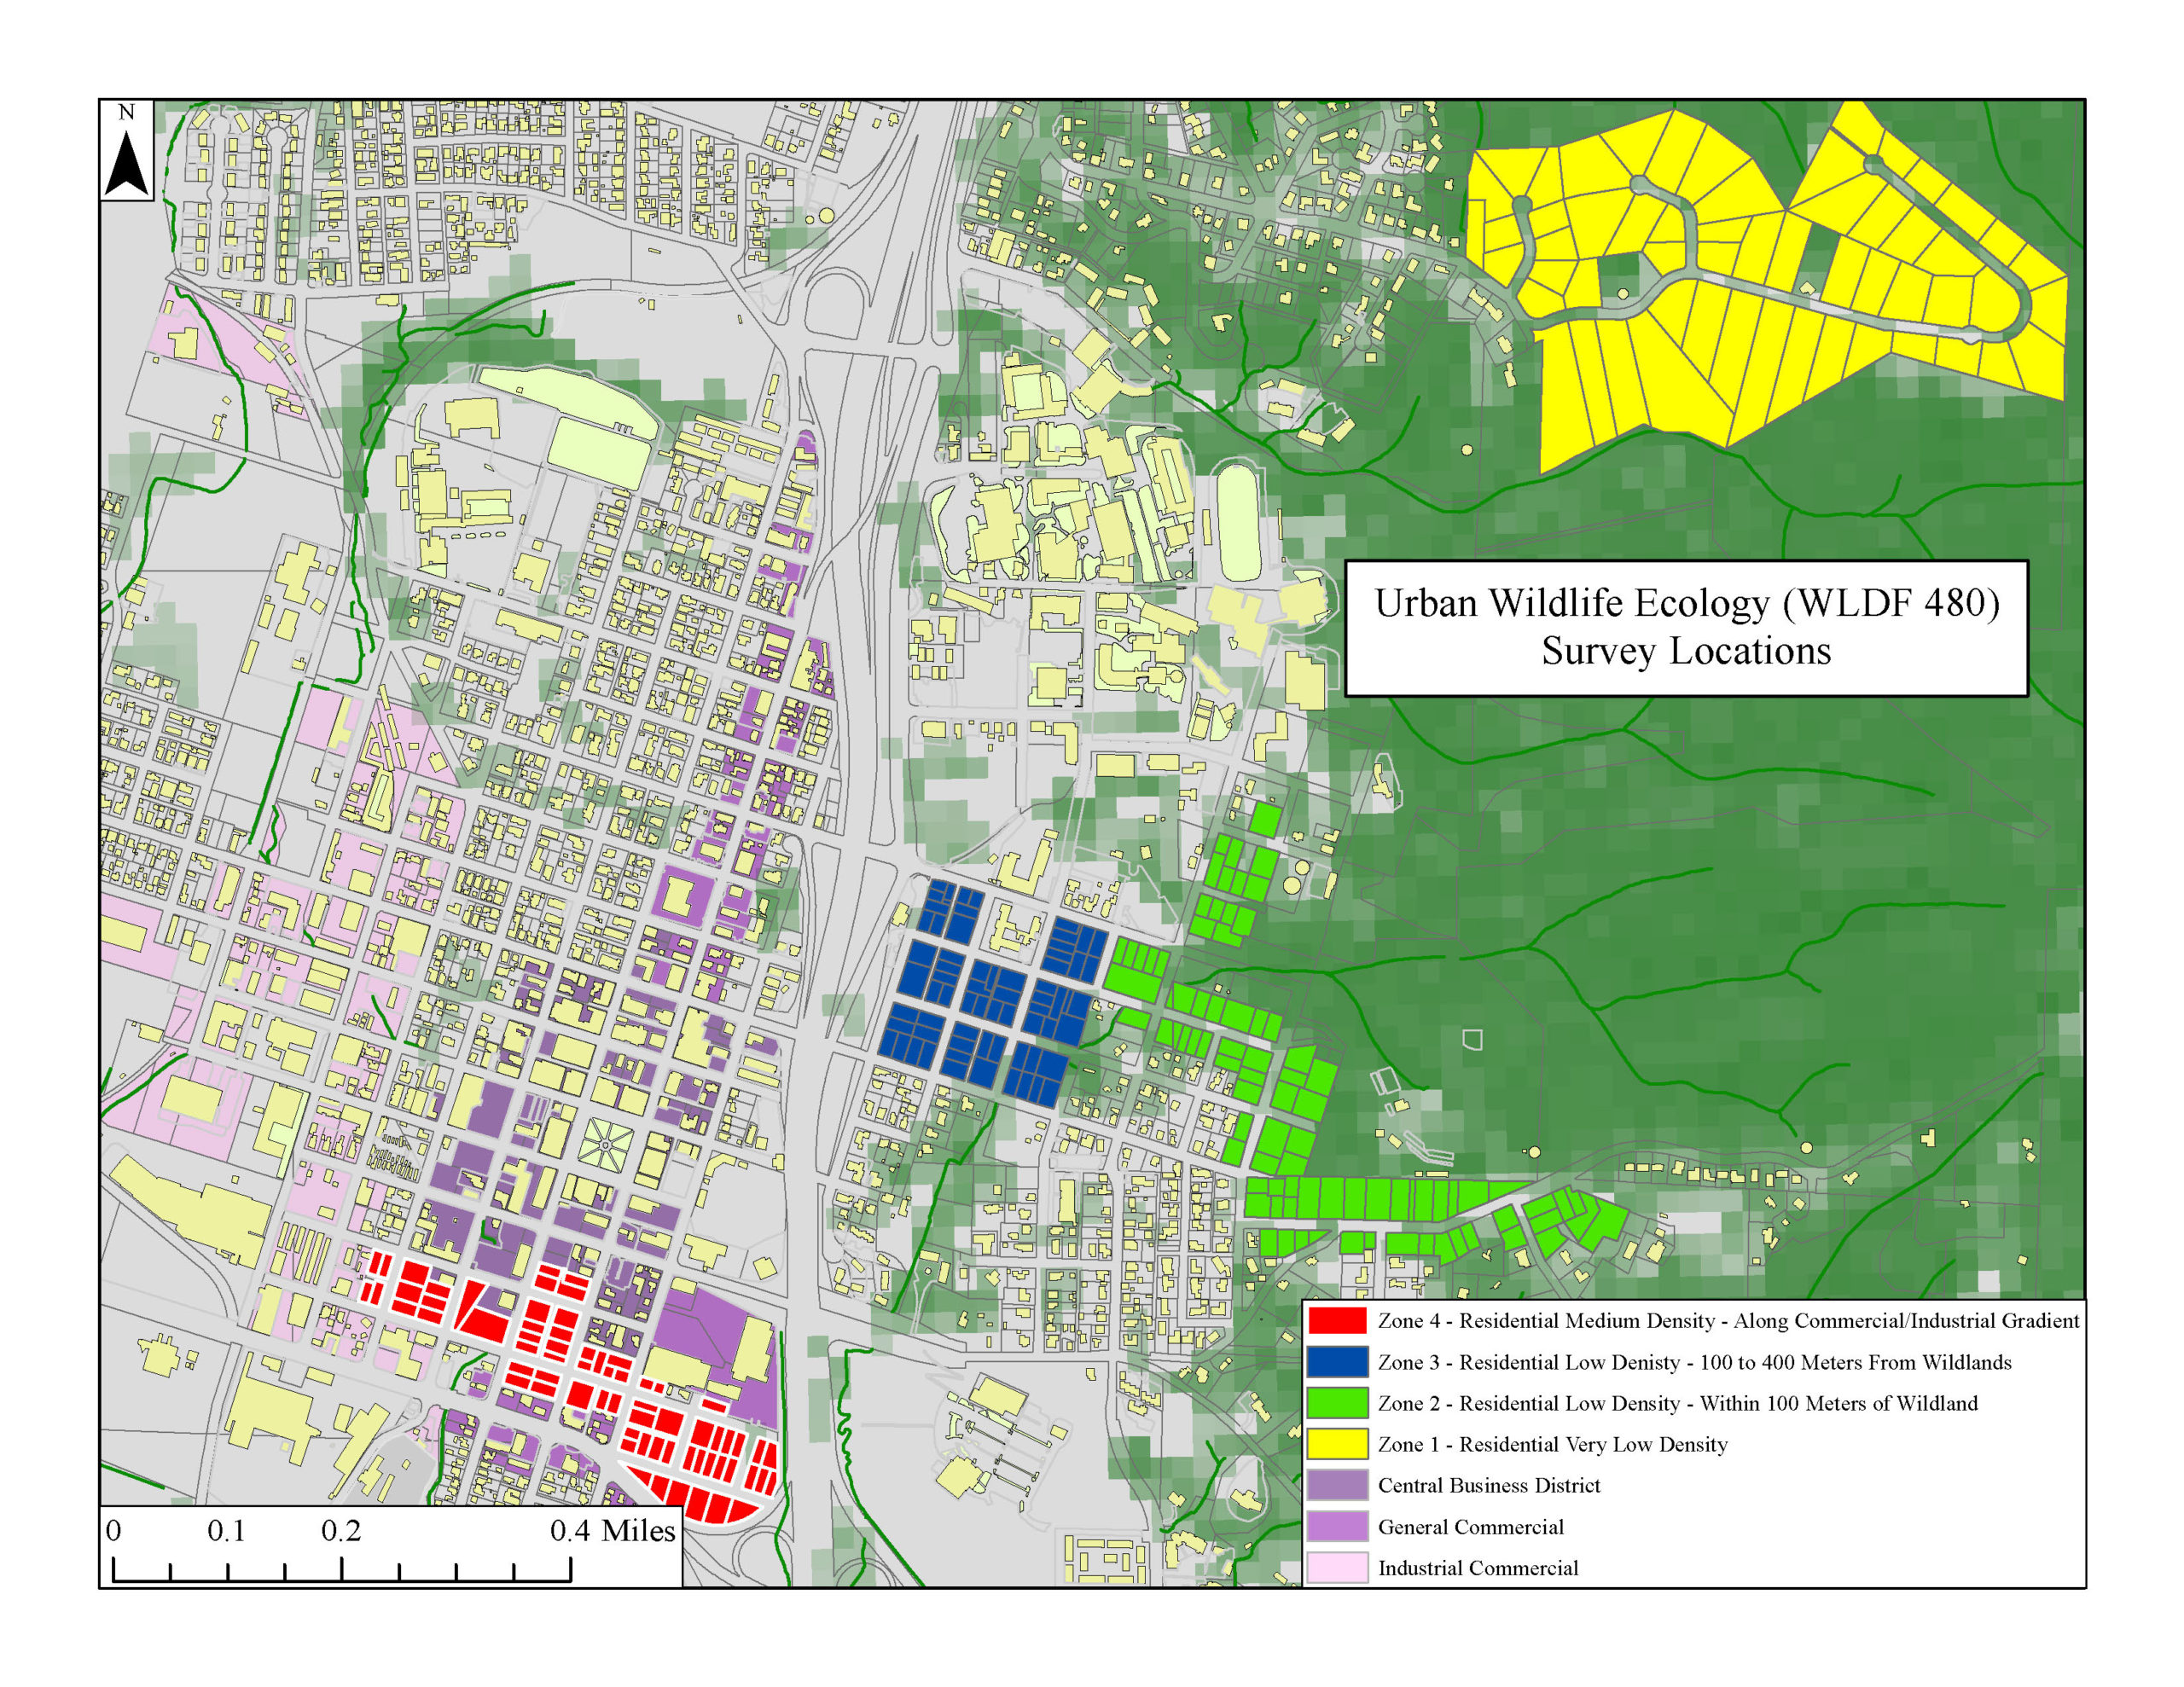
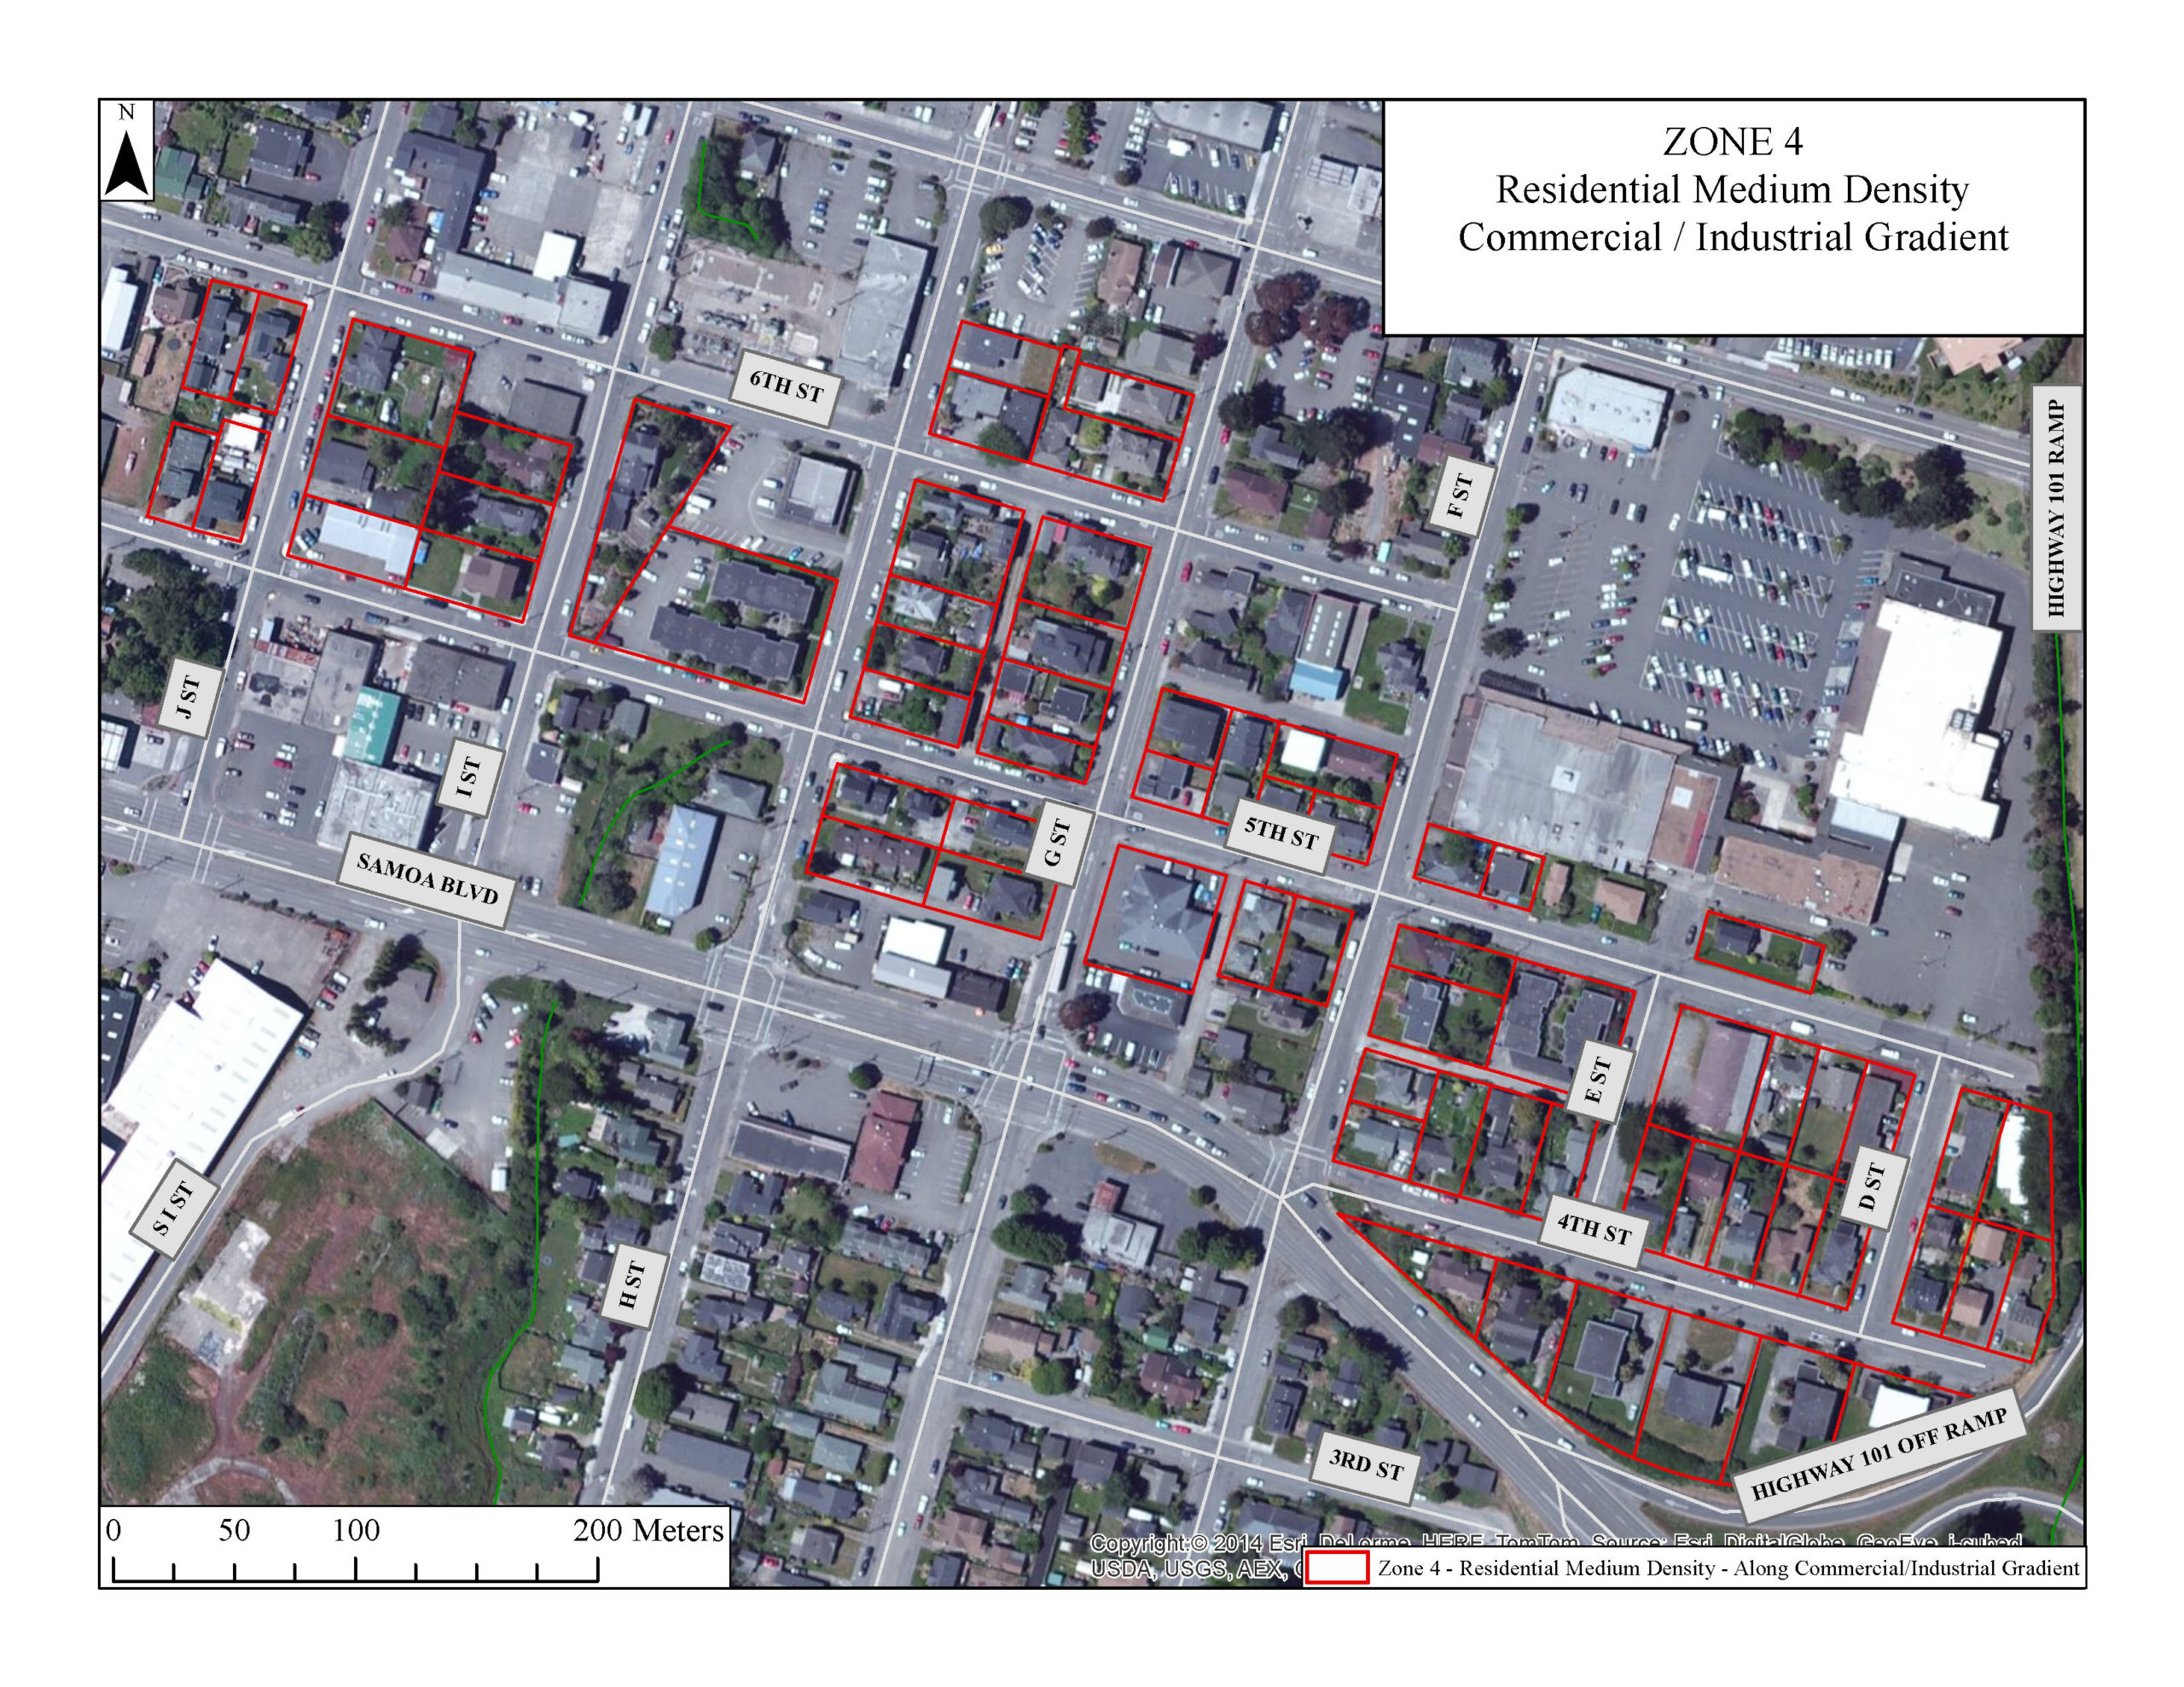
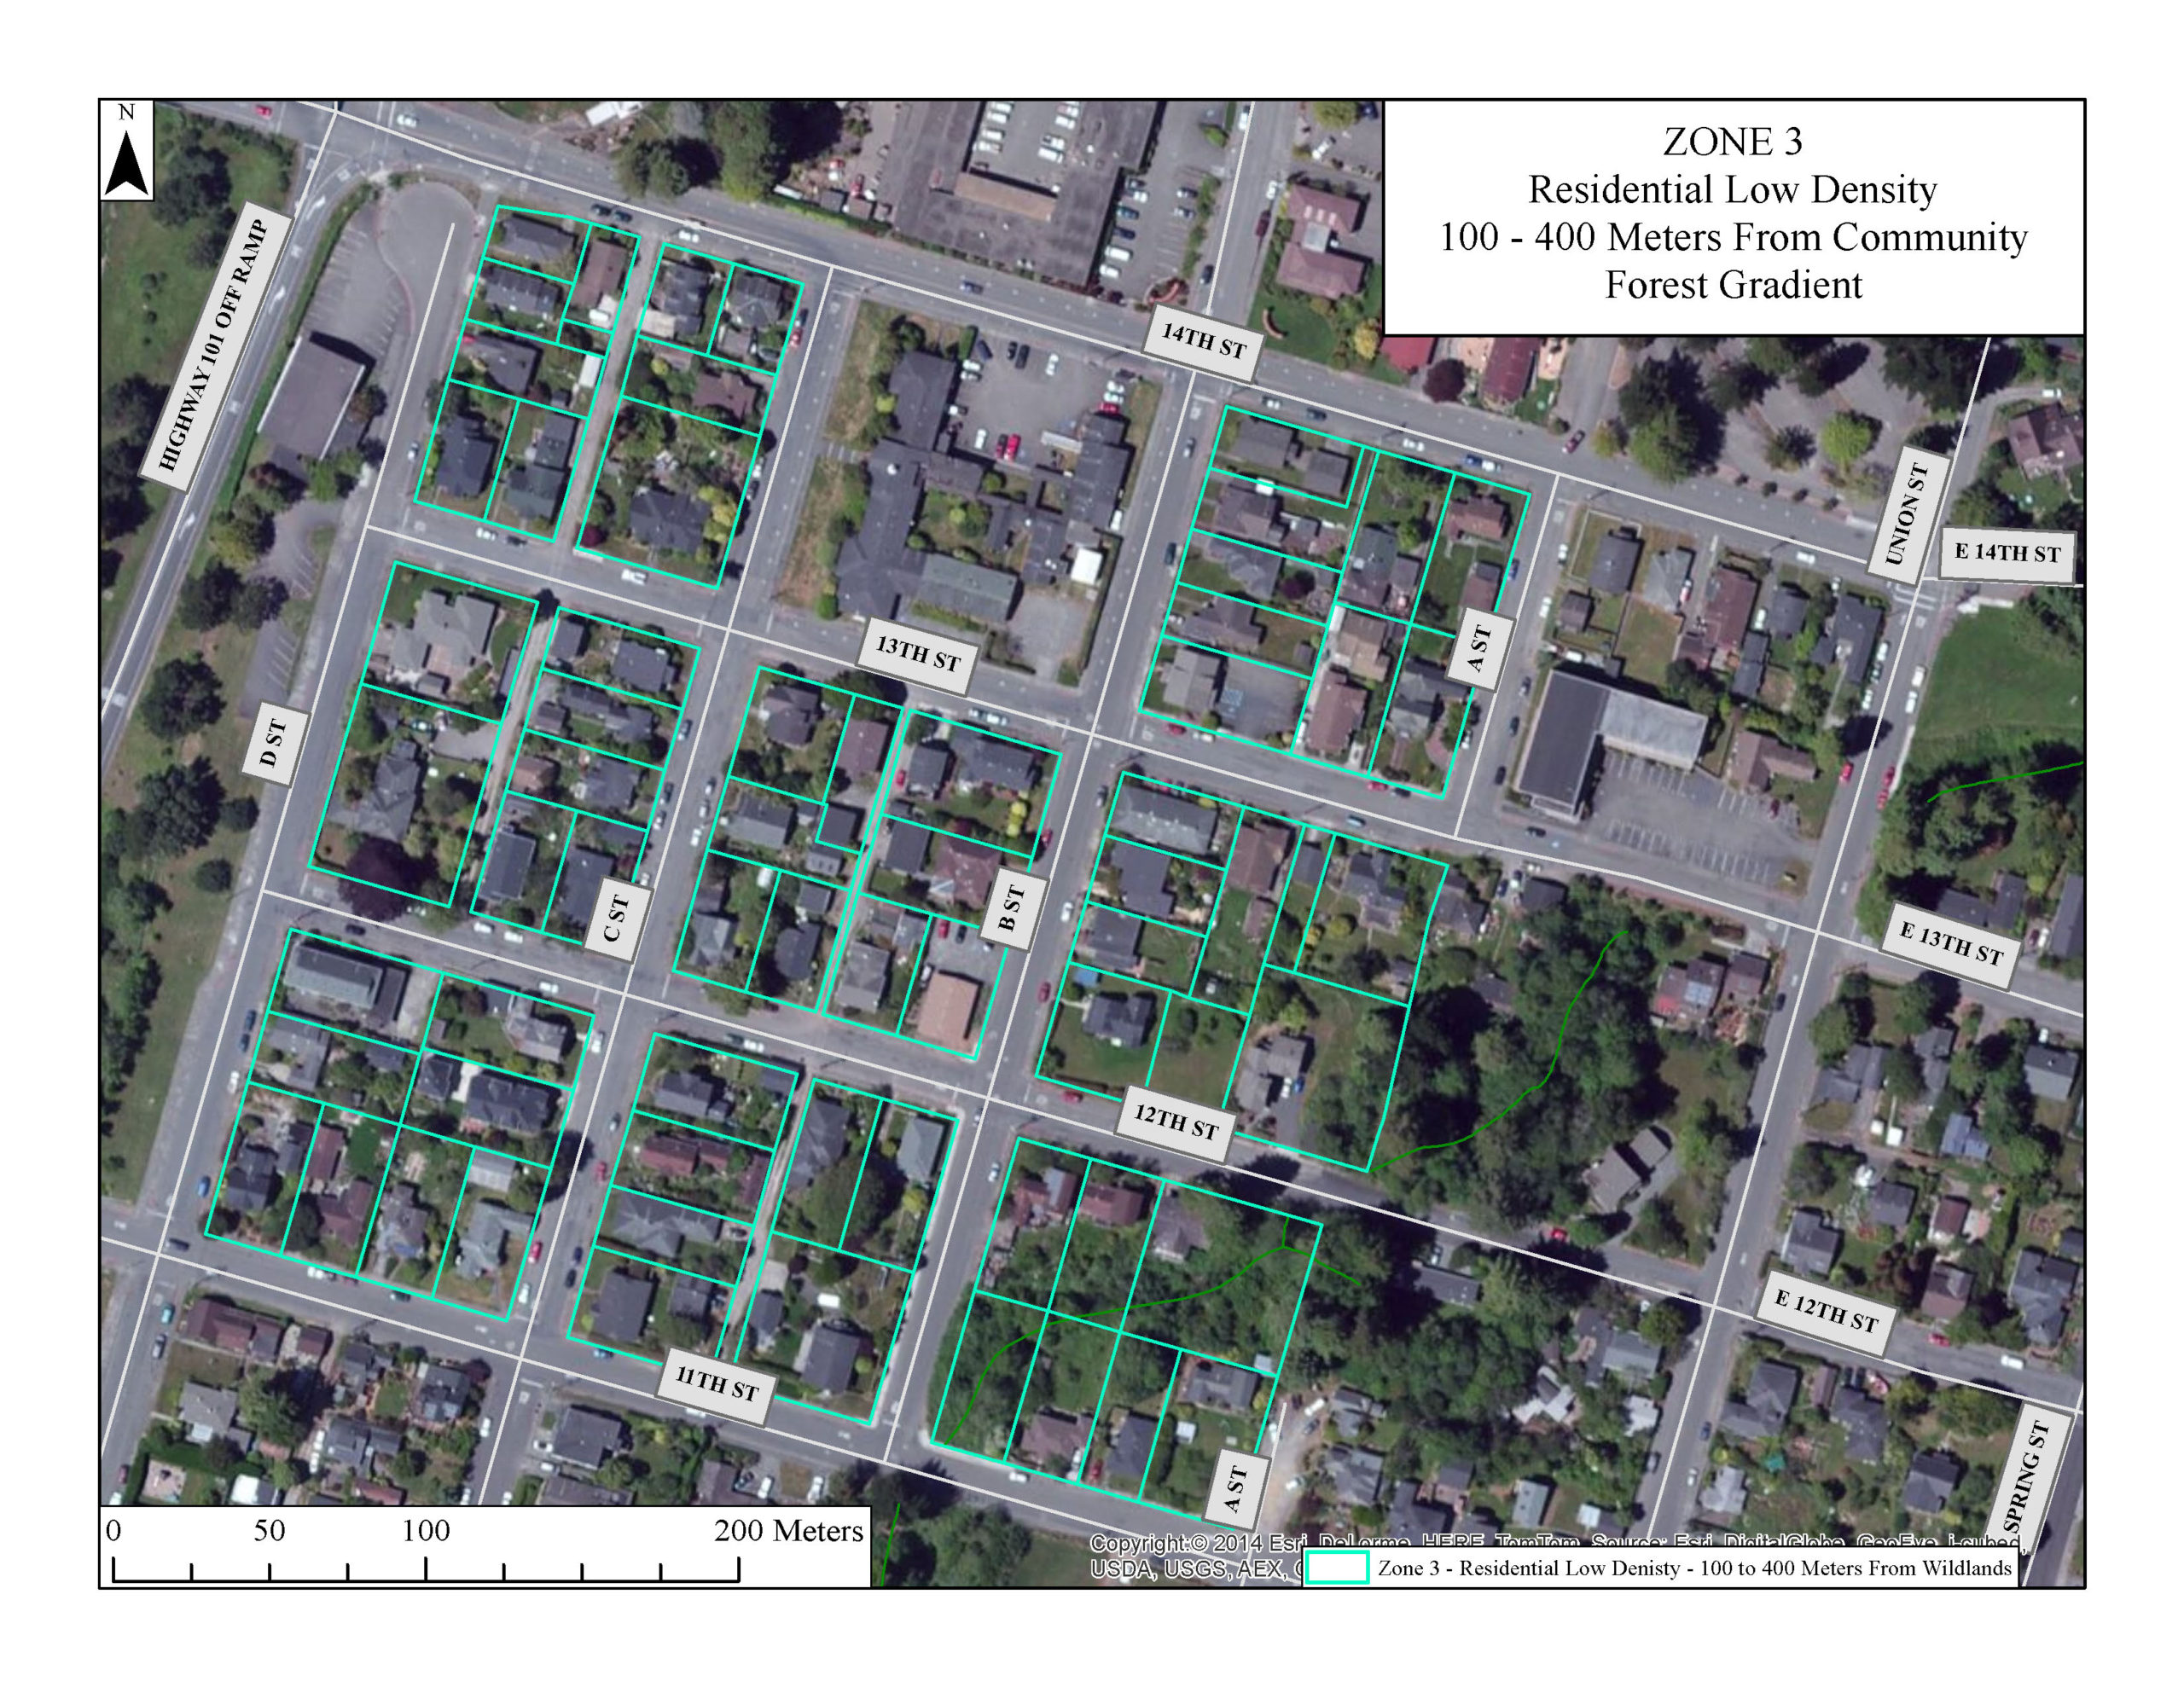
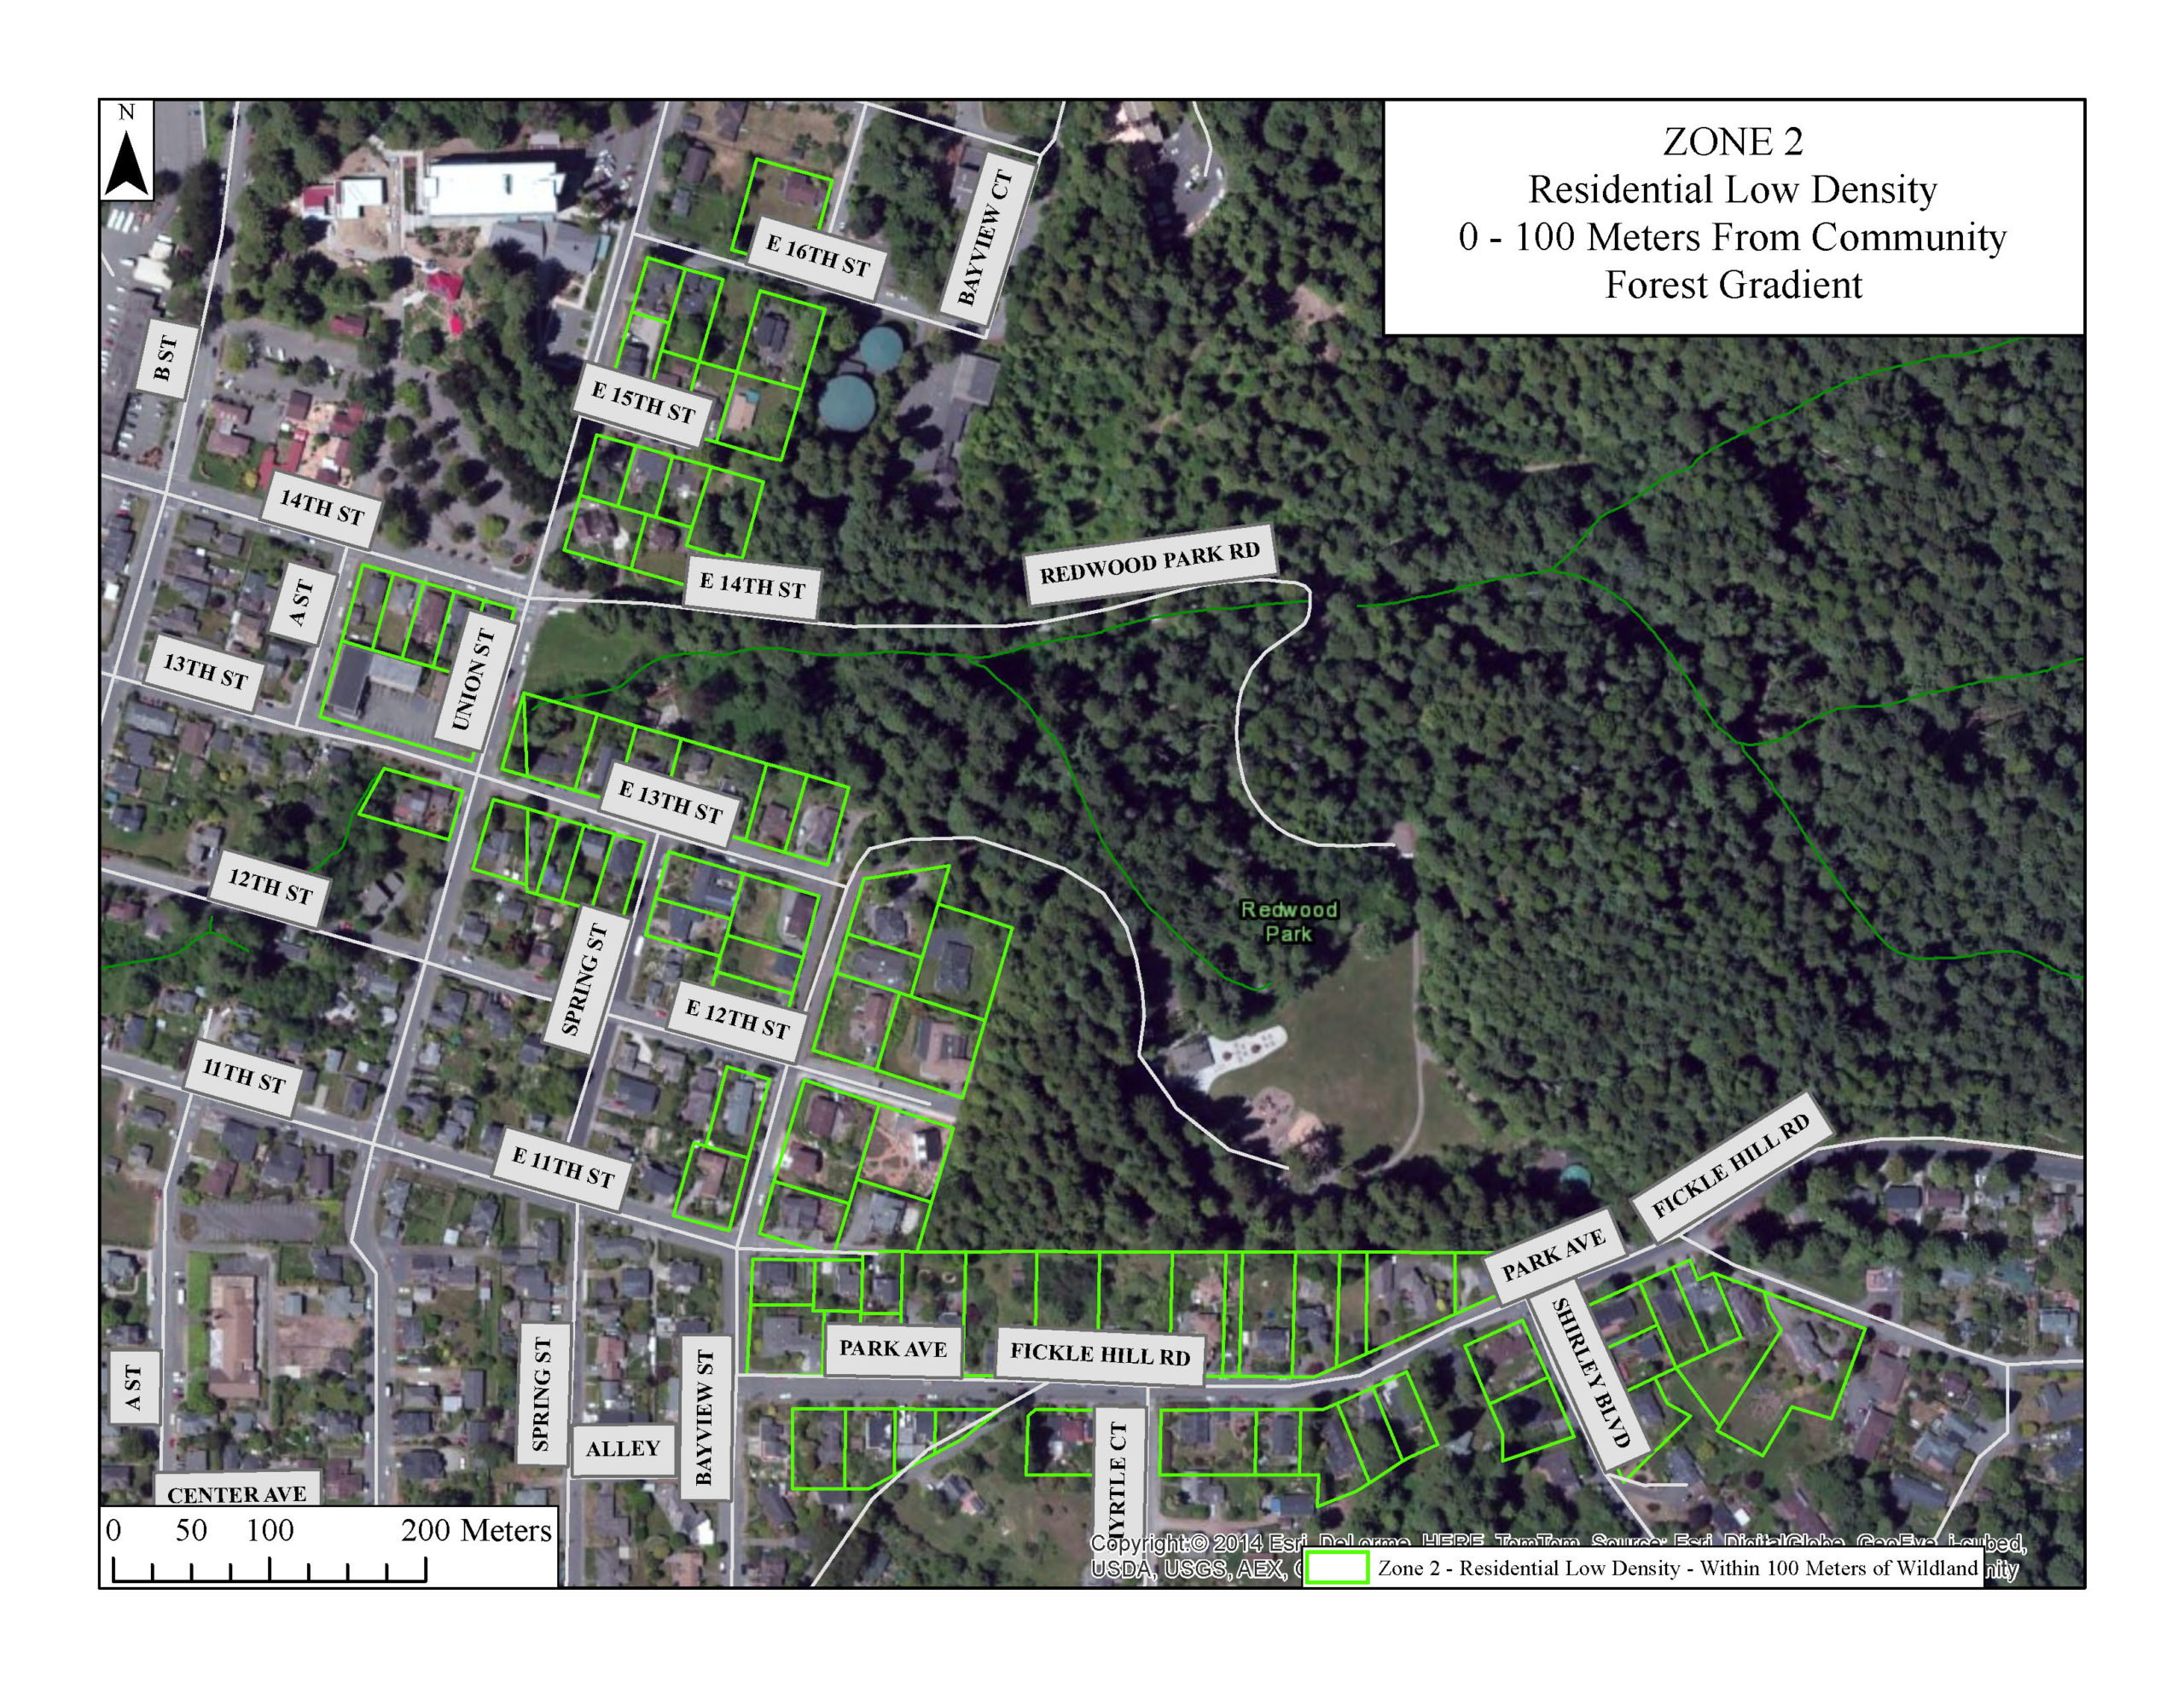
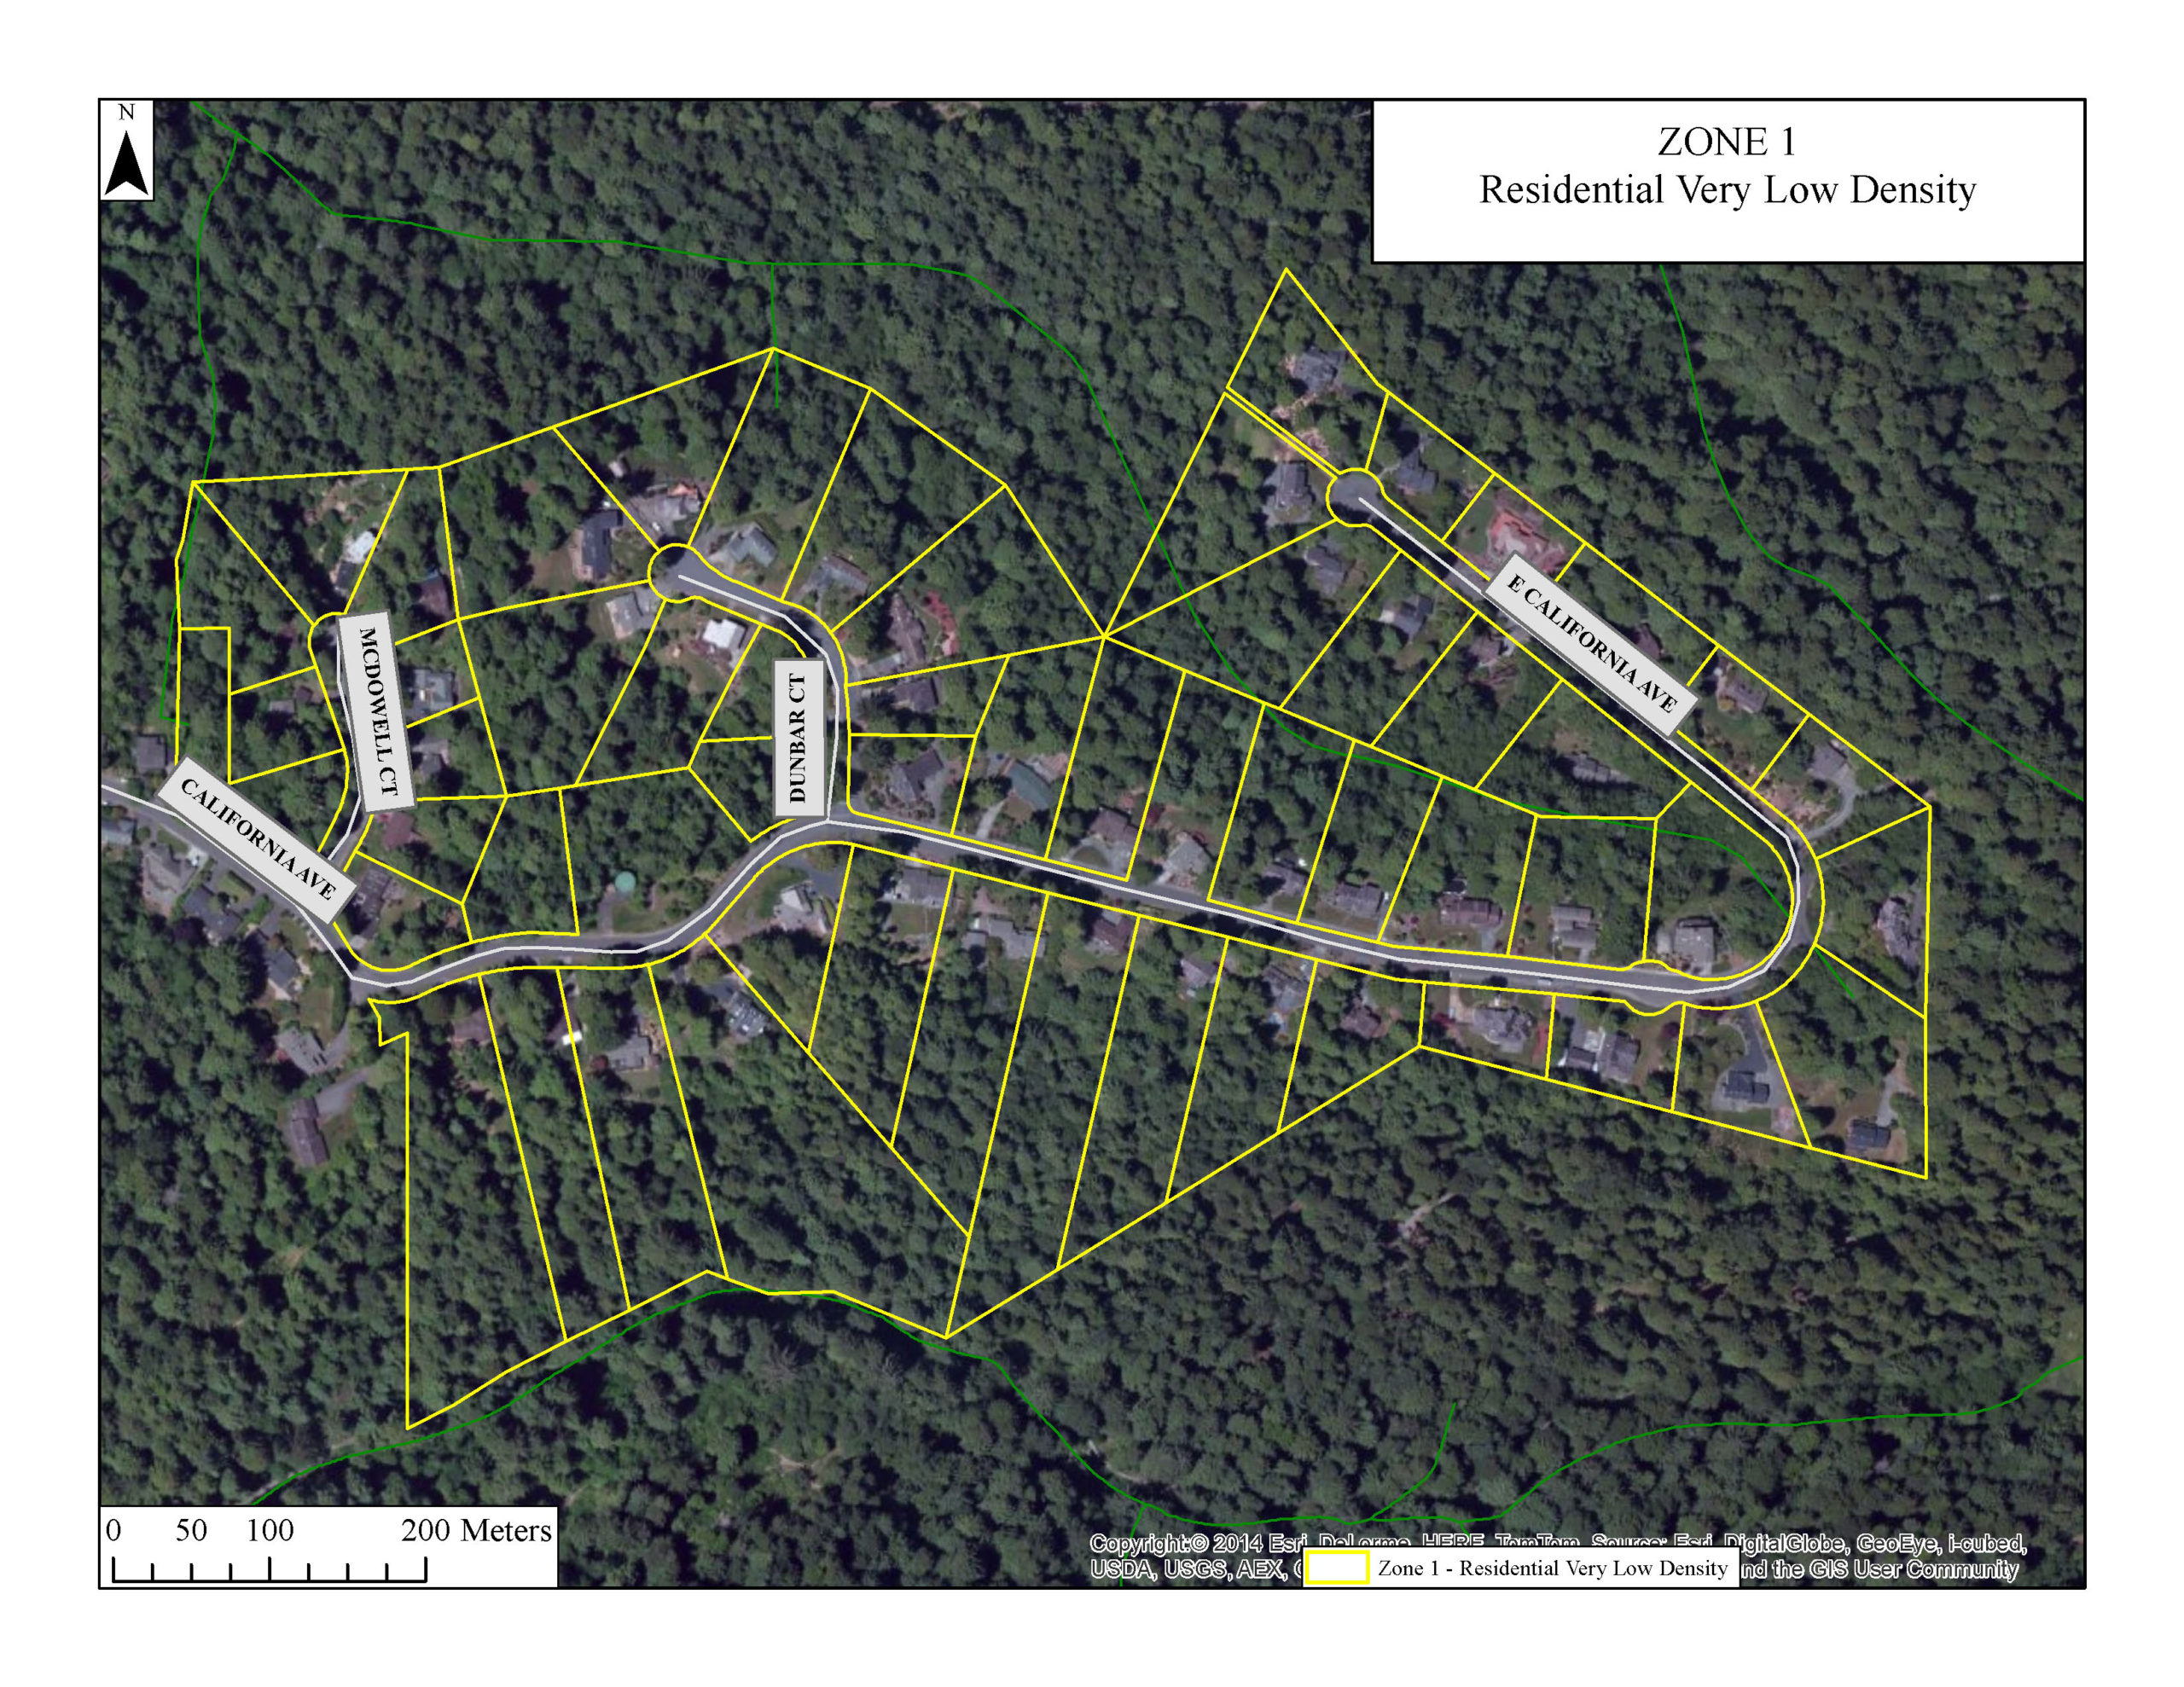
For our study, we developed a door-to-door survey to determine various factors about each respondent’s relationship with urban wildlife. When choosing which houses to survey, we used ArcMap 10.1 to delineate four distinct zones with varying densities. Zoning data was acquired online from the City of Arcata. The different zones defined an urban transect that extended from a Industrial zoned area with medium-density residential housing, to a heavily forested, very low-density residential area with no commercial operations (Table 2). The two mid-zones were characterized by little to no commercial activity, low density residential, and their distance to the Arcata Community Forest.
Students in HSU’s Urban Wildlife Ecology class administered each survey in pairs during a two-week period in April 2014. The survey was approved by the HSU Institutional Review Board, and consisted of 17 questions. Questions were divided into categories based on wildlife in and around respondents’ homes, domestic animals and pets, general wildlife activities, and socioeconomic data. In order to ensure participant’s privacy, no personally identifying data was collected. Once the surveys were complete, we analyzed datasets to determine if attitudes and behavior towards pets and wildlife differed among varying levels of conservation organization membership, homeowner status, and education.
Survey Area | Residential Zoning District | Minimum Lot Area (sq. ft.) | Residential Area (units/acre) | Distance from Wildland |
|---|---|---|---|---|
1 | Very Low Density | 20,000 | 2 or Fewer | Intermixed |
2 | Low Density | 6,000 (average) | 2 to 7.25 | 100m |
3 | Low Density | 6,000 (average) | 2 to 7.25 | 100m to 400m |
4 | Medium Density | 3000 | 7.26 to 1513 Correction: The required density is actually 20 to 42 persons per acre. Because the medium density residential zone within our surveyed area is located within the designated costal zone, density requirements are set through the local coastal program (LCP), and not through the Arcata Land Use Codes. | 400m to 800m14 400m to 800m from the Arcata Marsh and Wildlife Sanctuary, and 600m to 1,200m from the Arcata Community Forest. |
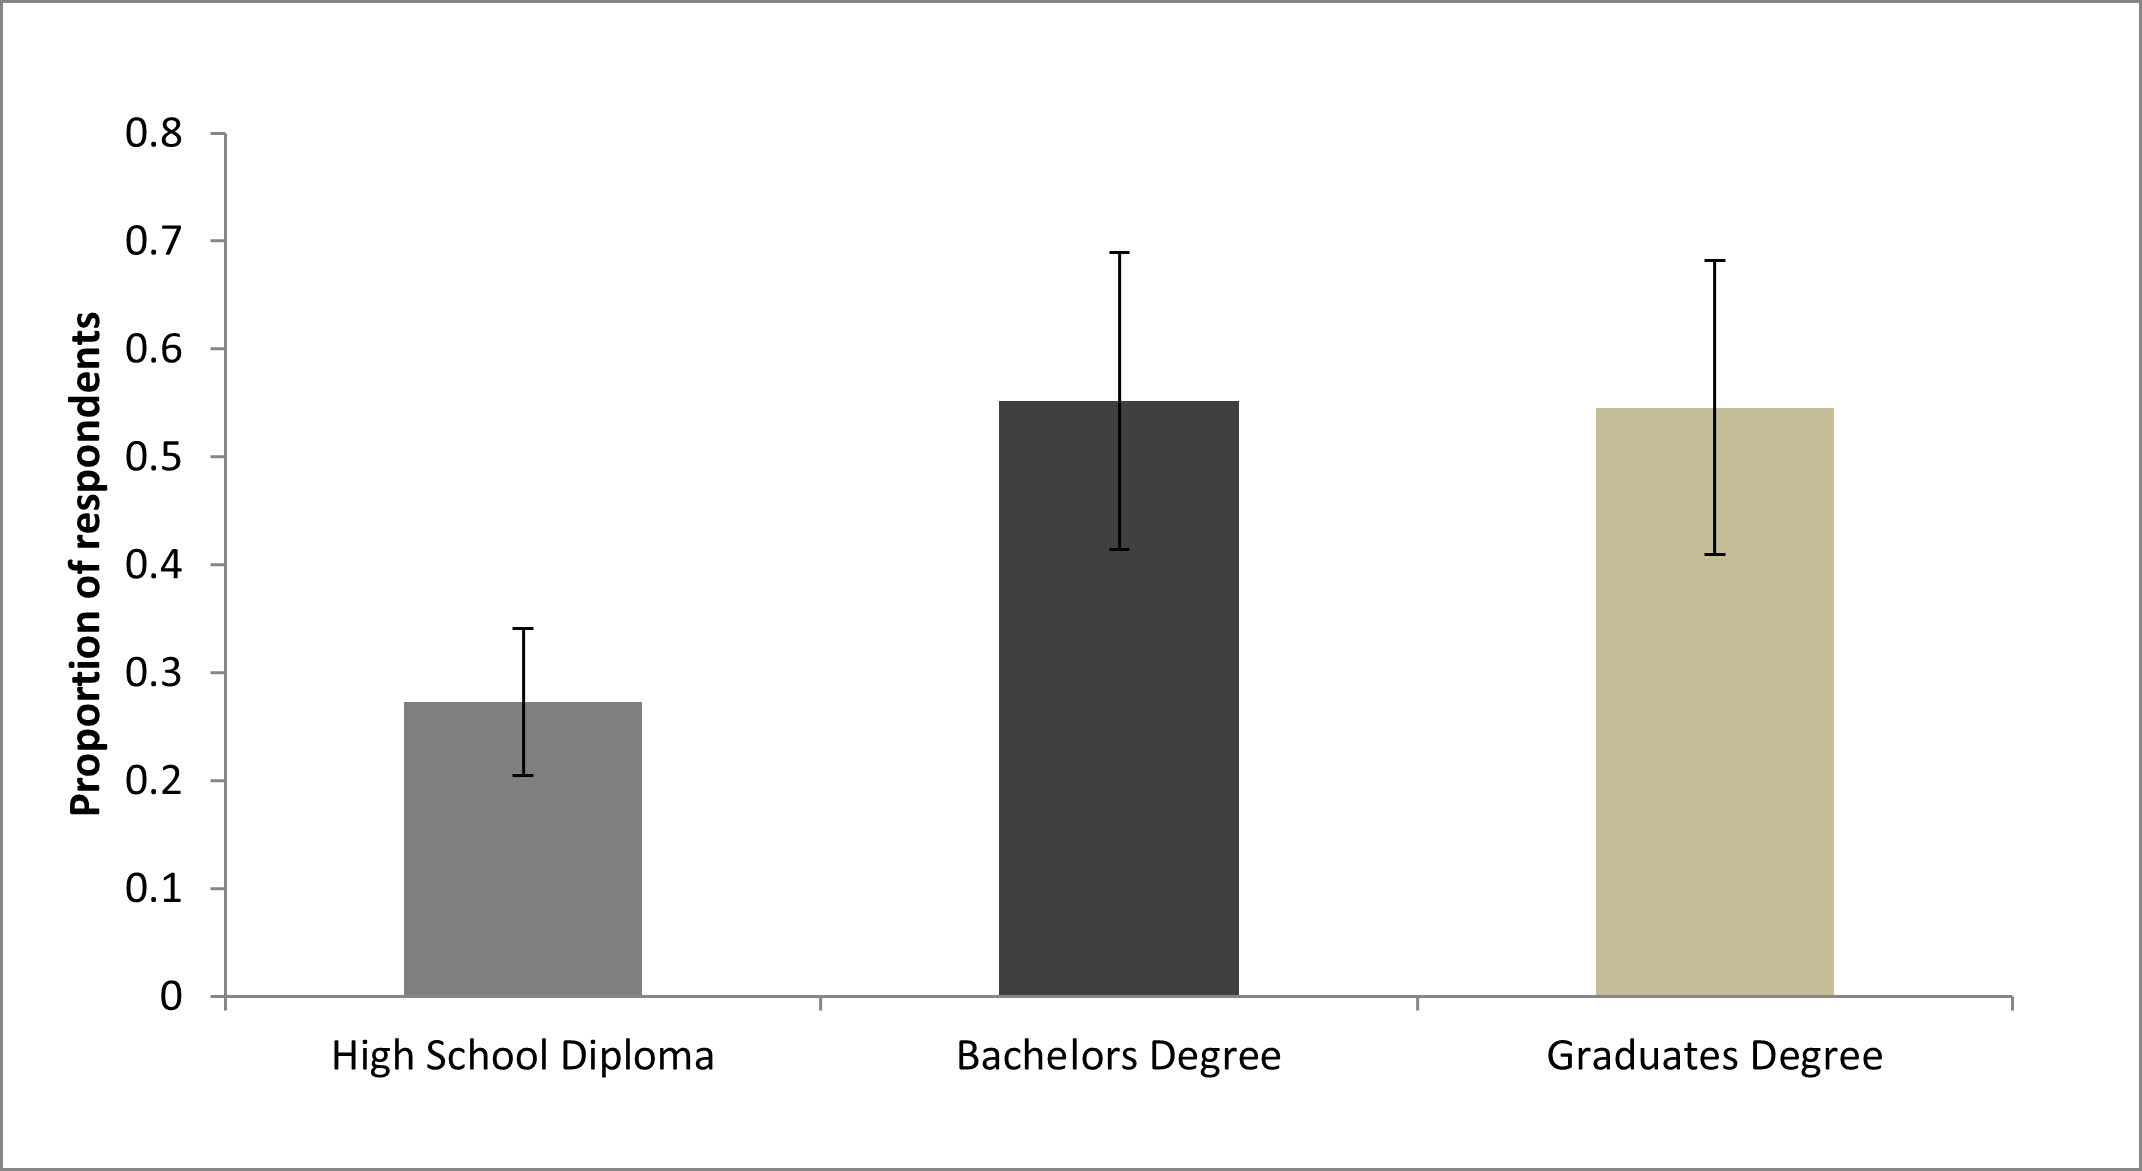
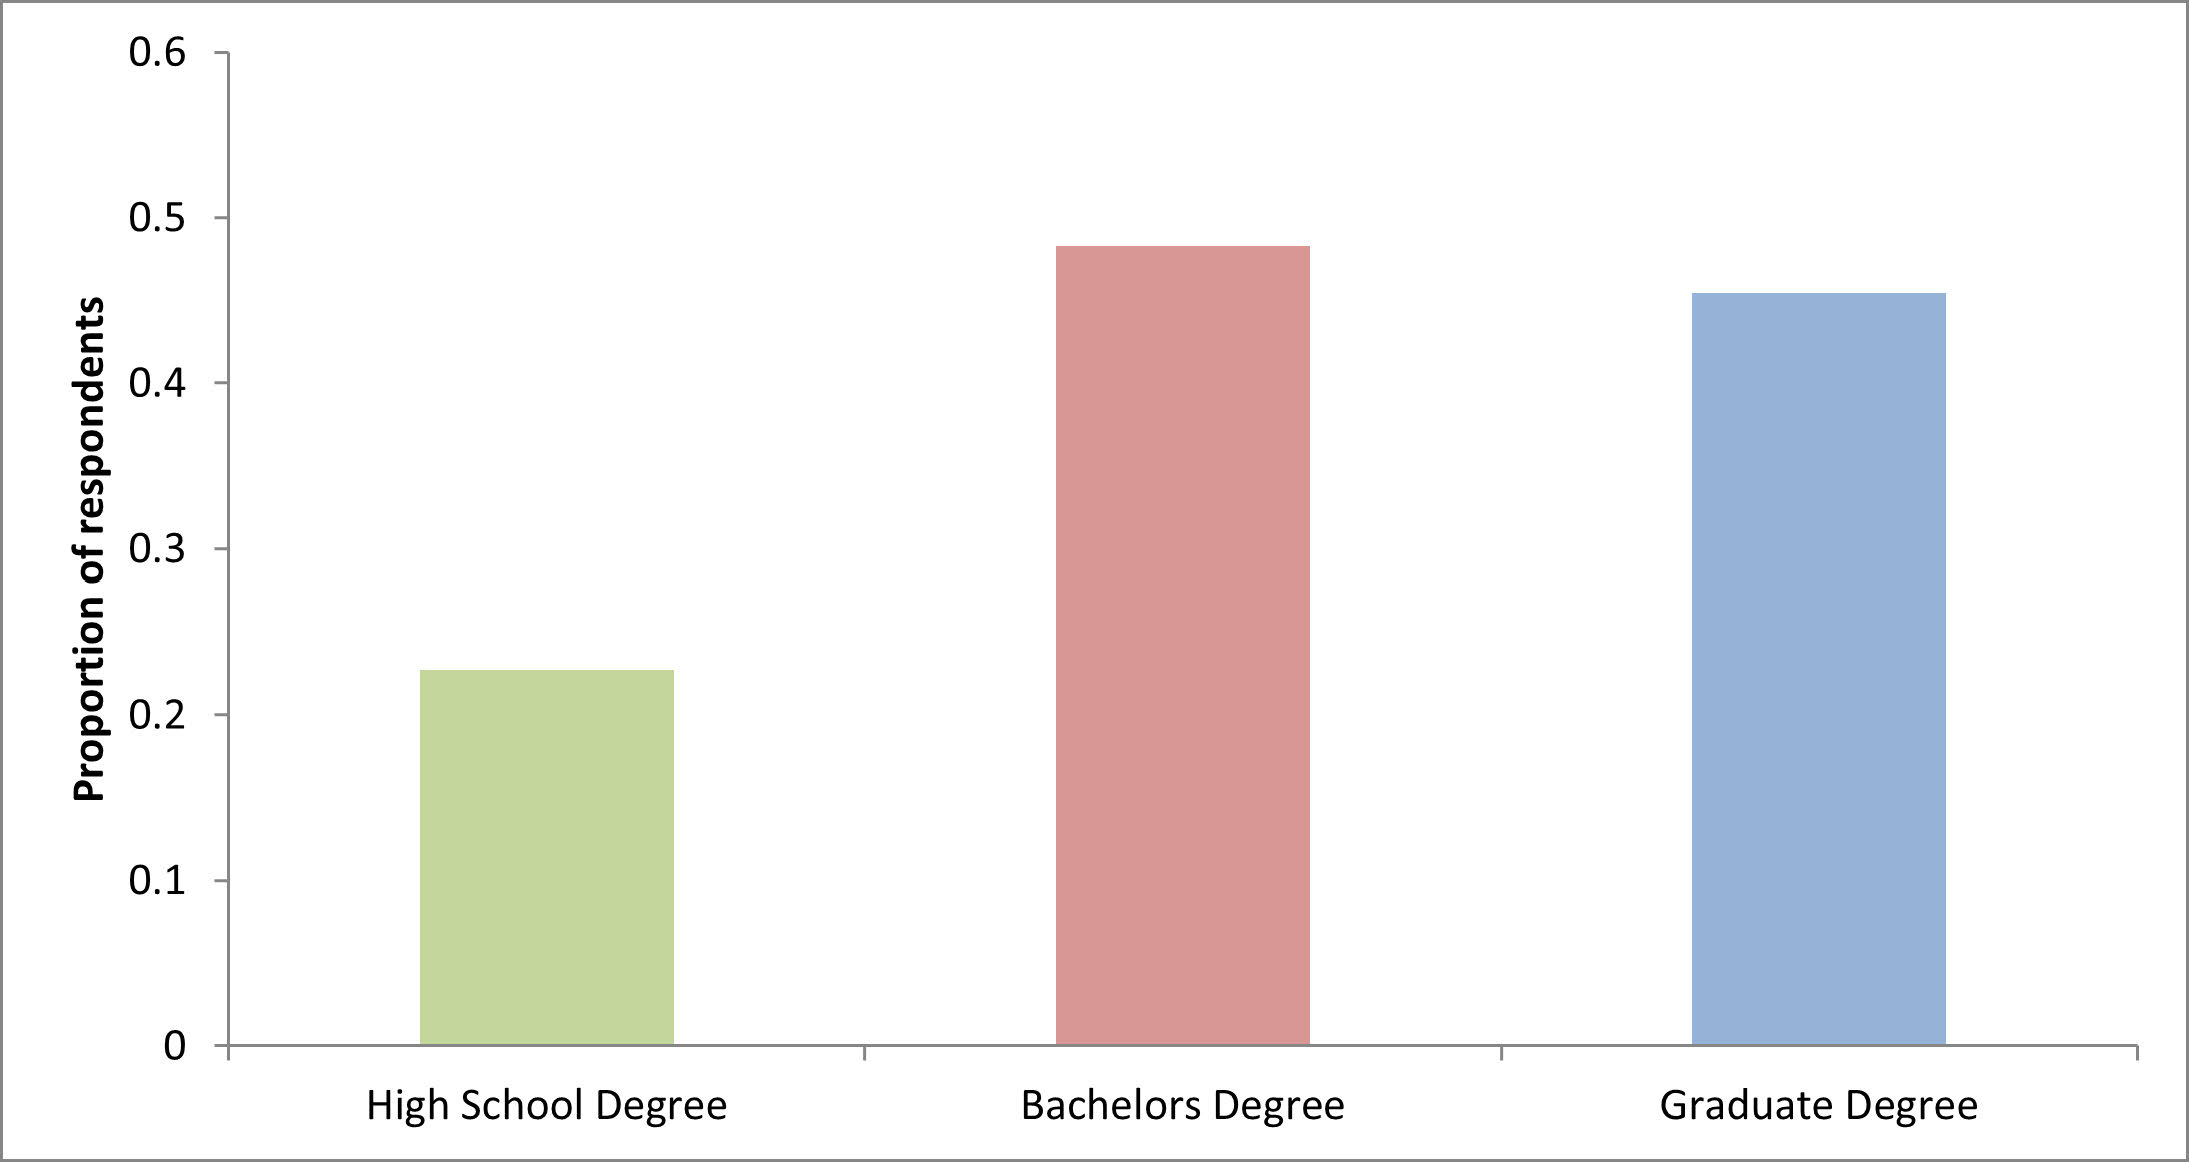
Our study was intended to determine factors that may differ depending on a respondent’s involvement in a conservation organization. Of the 39% of survey respondents that belong to conservation organizations, 62% of these respondents were female. Respondents with a bachelor’s degree or higher were twice as likely to be a member in a conservation organization as those a without a college degree (Figure 1). Two or more respondents considered themselves members in the following organizations: the Environmental Protection Information Center (EPIC); the Sierra Club; the Nature Conservancy; Friends of the Dunes; the Audubon Society; the World Wildlife Foundation; the Northcoast Environmental Center; the Natural Resources Defense Council; and Greenpeace.
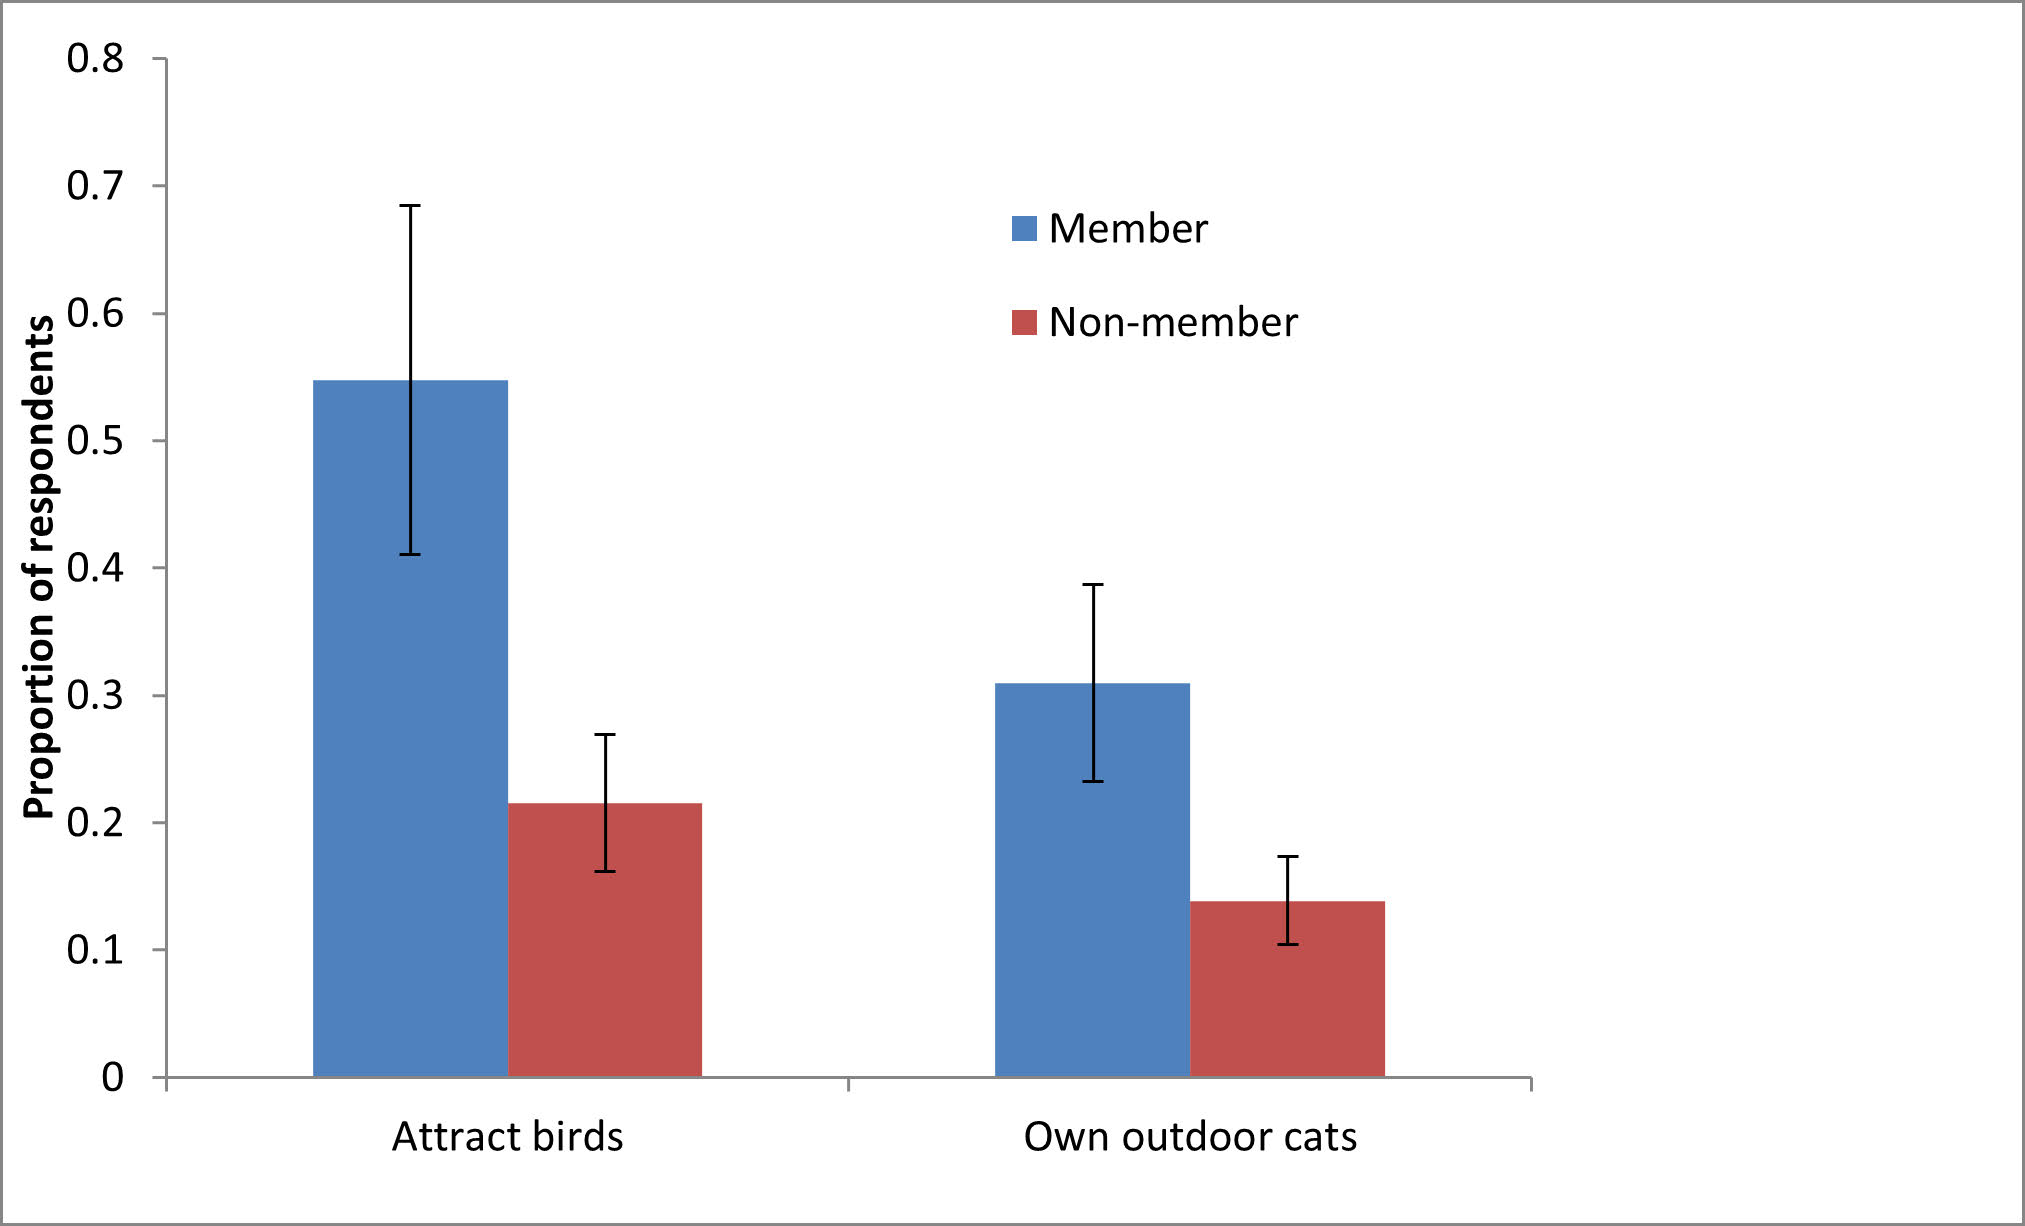
Respondents that considered themselves members of conservation organizations were more than twice as likely to attract birds to their homes and yards as non-members were (Figure 2). However, conservation organization members were also twice as likely to own outdoor cats as non members (Figure 2). Of all the respondents, 80% said that protecting wildlife was very important to them, but 67% of these respondents owned an outdoor cat.
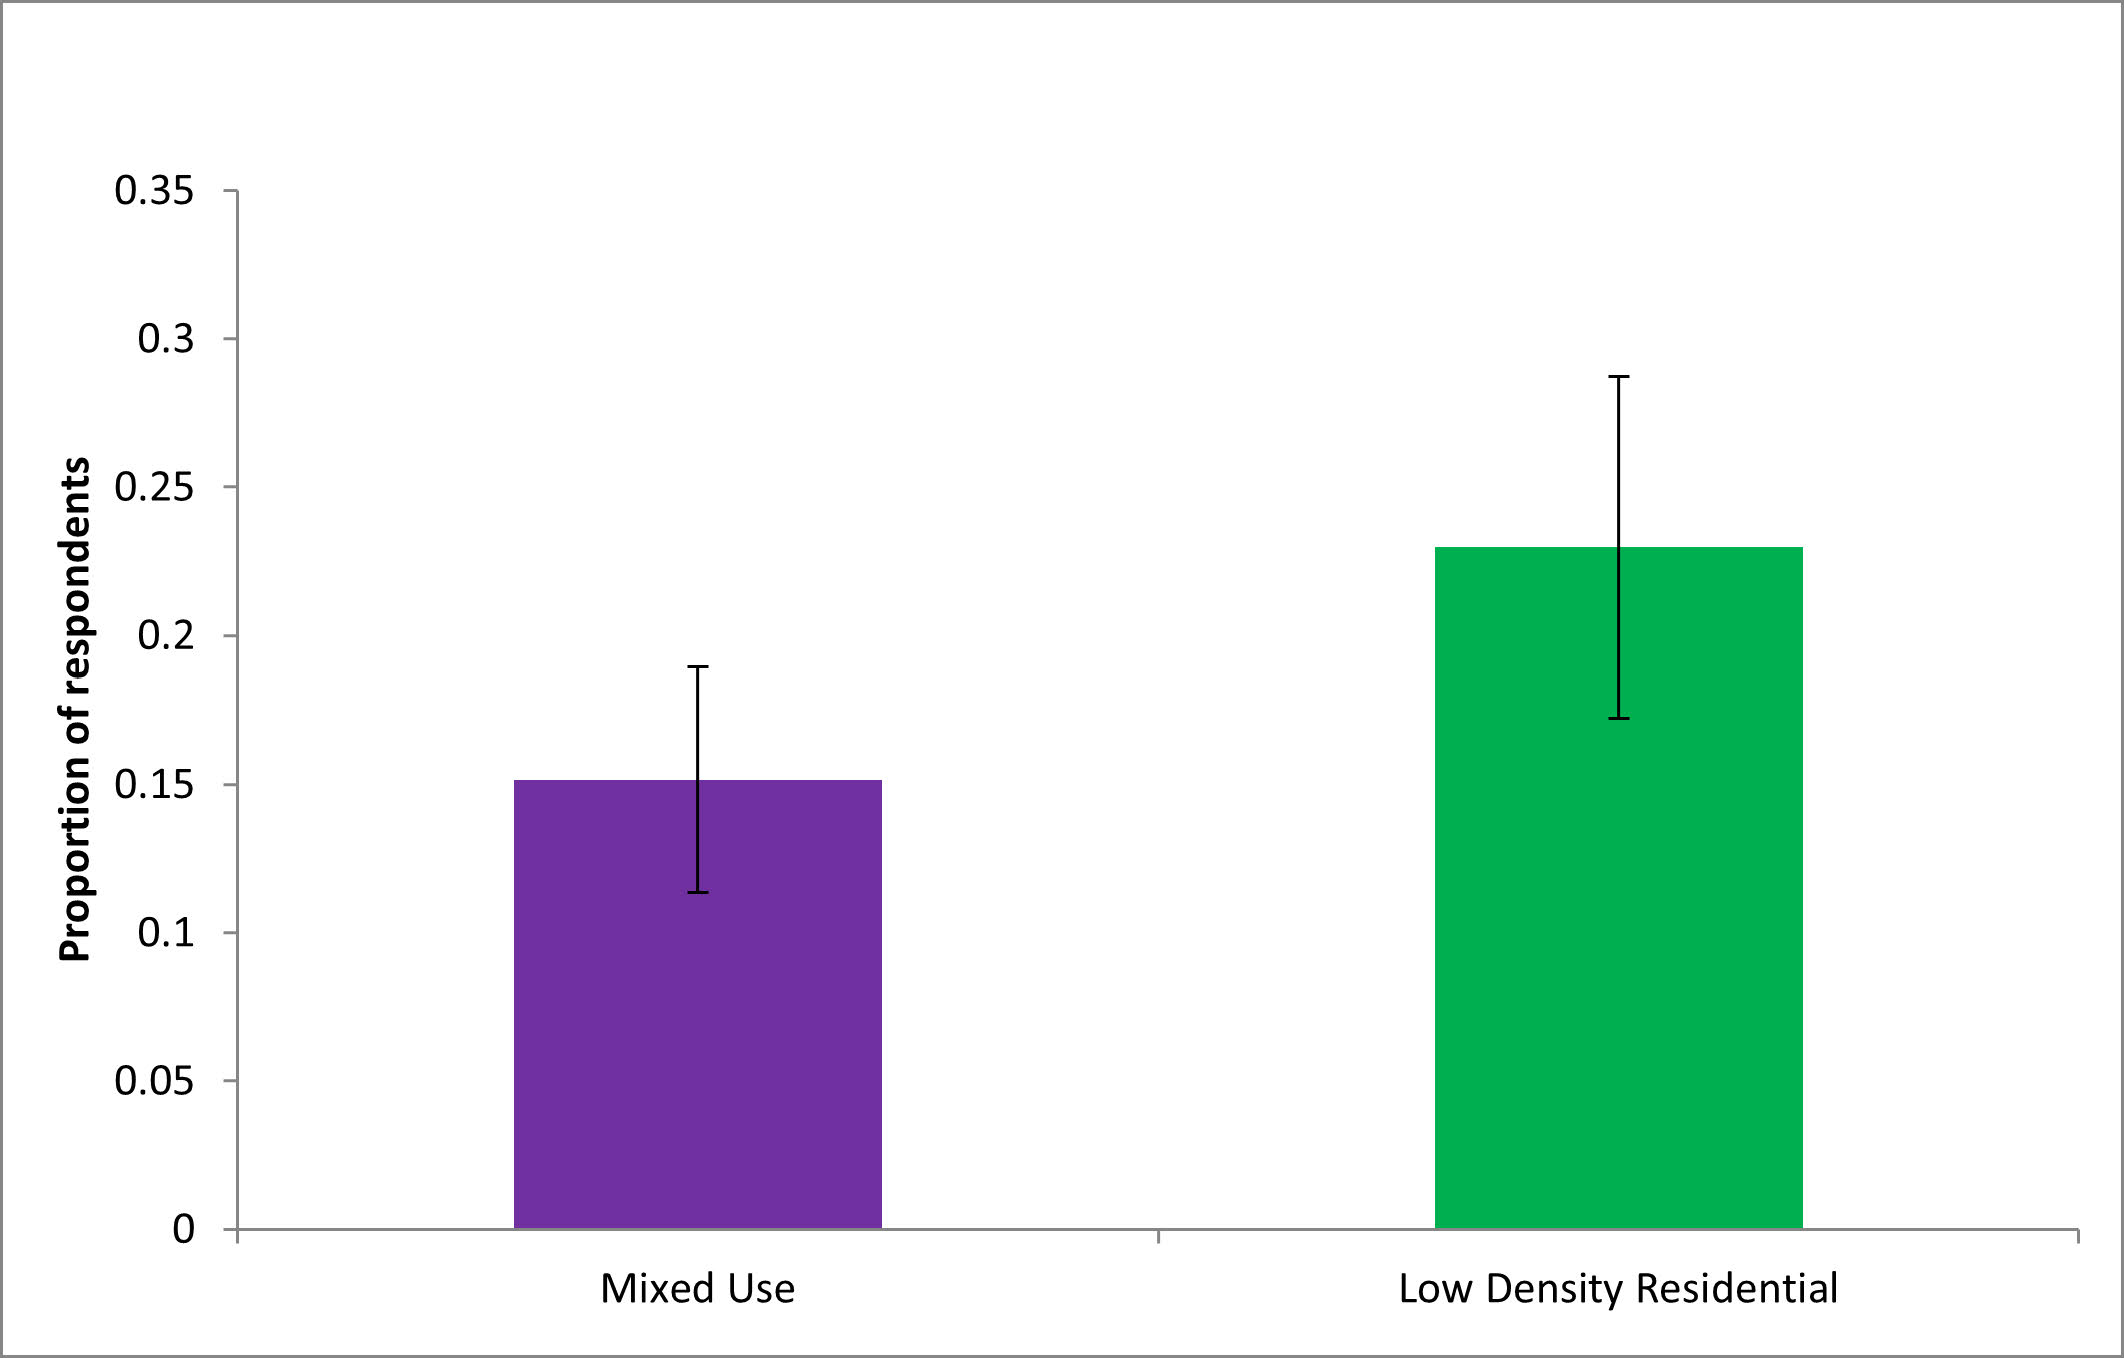
Other factors that related to outdoor cat ownership include zoning densities and whether the respondents rented or owned their respective home. Respondents living in a medium density area with commercial activity owned fewer outdoor cats than respondents living in lower density neighborhoods (Figure 3). Respondents who rented (14 %) were half as likely to own cats than homeowners (30%) were. Renters were much less likely to attract wildlife to their homes than homeowners were. Attracted wildlife included birds, insects (bees), butterflies, moths, bats, deer, rabbits, and raccoons. Those who had not attained above a high school degree were less likely to attract wildlife to their homes when compared to those with bachelor and post-graduate degrees (Figure 4).
Although the survey did not support all of our expectations, many of the trends we expected to see were supported. Women in this study were almost twice as likely to belong to conservation organizations. This supported our first prediction, and is further indicated by prior research indicating the women may feel more empathy towards wildlife and are involved in more animal activism movements than men.15A. H. Kidd et al., Characteristics and Motives of Volunteers in Wildlife Rehabilitation, 79 Psych. Reps. 227 (1996); Brian Czech et al., The Relationship of Gender to Species Conservation Attitudes, 29 Wildlife Soc’y Bull. 187 (2001). This is critical, as understanding more about the roles gender may play in conservation efforts will help educators and conservationists focus their efforts. Those with a bachelors degree or higher were also more likely to belong to conservation organizations (“COs”). We expected to see this, as previous studies have shown education level is positively correlated with environmental concern.16Kent D. Van Liere & Riley E. Dunlap, The Social Bases of Environmental Concern: a Review of Hypotheses, Explanations and Empirical Evidence, 44 Pub. Op. Q. 181 (1980). This outcome could potentially correlate with a number of factors, including increased income to devote to various memberships.
Members of conservation organizations did more to attract birds to their yards than non-members in our study. Based on the idea that members may intrinsically feel more enthusiastic towards wildlife (as indicated by their involvement in CO’s), we expected to find this. Our data also showed that CO members were more likely to own an outdoor cat than non-members. This trend defied our expectations, but may potentially be due to the fact that CO members generally have a higher education level and thus more likely to be a homeowner than non-members, increasing the likelihood of owning a cat. However, this may also indicate that people’s stated attitudes towards wildlife may not coincide with their actions. Again, this knowledge is critical as education campaigns are considered. CO’s could use this information to develop strategies aimed specifically towards their members. Over half of the respondents who stated wildlife conservation was very important to them owned outdoor cats. Again, our results revealed a dichotomy between people’s stated attitudes and their actual actions. This may be explained by the fact that respondents tried to choose socially acceptable answers instead of truthfully answering questions. This may have overrepresented the number of those who have a high concern for wildlife conservation, and underrepresented those who own outdoor cats.
When studying urban wildlife ecology, it is important to discern behavioral differences between renters and homeowners. It met our expectations to learn that twice as many homeowners were twice as likely to own cats when compared with renters. This may be attributed to the fact that rental contracts frequently deny animal ownership, whereas homeowners do not typically have these restrictions. Renters also did far less to attract wildlife their homes than homeowners. Prior research indicates that homeowners have more incentive to make long term improvements, and are more likely to have trees on their properties, indicating an active desire to see more biodiversity on their property.17 Tenley M. Conway et al., Community Groups and Urban Forestry Activity: Drivers of Uneven Canopy Cover?, 101 Landscape & Urb. Plan. 321 (2011). Our study also had a relatively small sample size, and could have been improved by further and more extensive research in Arcata. Overall, however, our findings indicated that our three main predictions were supported.
The future of urban conservation will be greatly driven by the scientific understanding of socioeconomic factors that drive conservation perceptions and values. As human population levels rise and urbanized areas rapidly increase, understanding more about an area’s attitudes towards wildlife is critical to developing appropriate educational and outreach strategies. Our study demonstrated that human-wildlife relationships differ depending on factors such as education, gender, CO involvement, and homeowner status.
We recommend that managers help develop community-wide education efforts that target specific demographics. Because promoting localized conservation requires a deep understanding of urban biodiversity patterns,18Ann P. Kinzig, The Effects of Human Socioeconomic Status and Cultural Characteristics on Urban Patterns of Biodiversity, 10 Ecology & Soc. 23 (2005). we also recommend that extensive research be done in each area before educational efforts are made. This will hopefully serve to maximize both the efficiency of manager’s efforts and gains from community outreach.
Credits. This report is my edited version of 2015 report coauthored by myself and Lauryl McFarland, under the guidance of Professor Barbara Clucas, Humboldt State University.
Credits. This report is my edited version of 2015 report coauthored by myself and Lauryl McFarland, under the guidance of Professor Barbara Clucas, Humboldt State University.
© 2019 – The Official Website for Jerry Dinzes.