Prior to taking on the official research assistant position at the Sturm College of Law, I independently produced maps to aid a racially restrictive covenants (RRCs) research project. The professor overseeing the project requested maps showing early census data for the period just prior to and following the Supreme Courts’ ruling that found the judicial enforcement of RRCs to be unconstitutional. (Shelley v. Kraemer, 334 U.S. 1 (1948).) The maps were not intended for publication, but served instead as a preliminary resource for analyzing trends in key cities.
Data Acquisition: Historic census data was acquired using the IPLUMS National Historical Geographic Information System (NHGIS). The datasets that are used here are “total population” and “negro population”.1During the census period of 1940 to 1960, the US Census did not allow for self-identification. The rule was generally that if a person had “one-drop” of African American blood, they were labeled as “Negro.” For a brief, but informative summary on this issue, see the Pew Research Center’s Race and the Census. To facilitate analysis of migration patterns, other relevant US Census tabulations were built into the datasets (e.g., how many housing units in a particular area). However, many of these tabulations are not taken regularly during consecutive census periods (e.g., “does housing unit have plumbing or no plumbing?” was asked during one decennial census but not the next), limiting the value of such data in producing a time series map. The housing related tabulations that most consistently span from 1940-1960 regard occupancy, ownership, and property value (or more specifically: vacancies, persons per unit, black ownership, white ownership, rental rates, and property values).
Joining Historic Census Data to Shapefiles: As with modern data acquired directly from the US Census, the tabulations from NHGIS must be joined to shapefiles for each corresponding year (historical derivations of TIGER data). The reason for this is that geographic bounds of census areas (e.g., tracts & blocks) change over time.
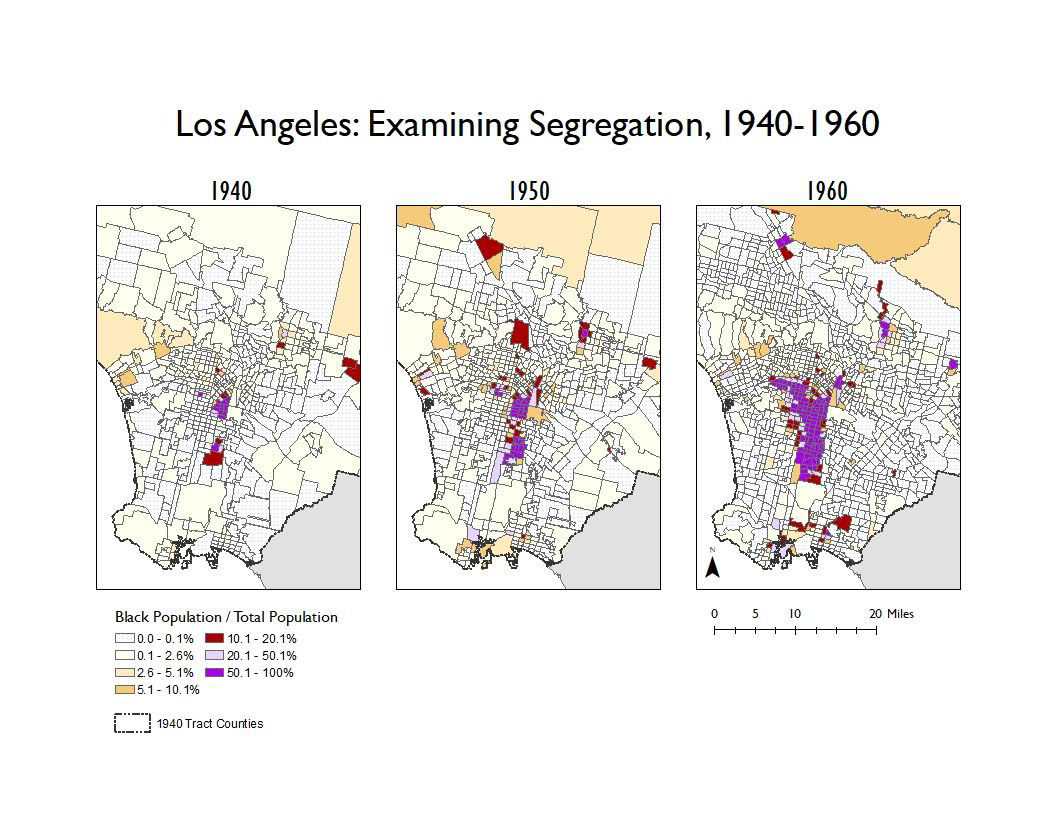
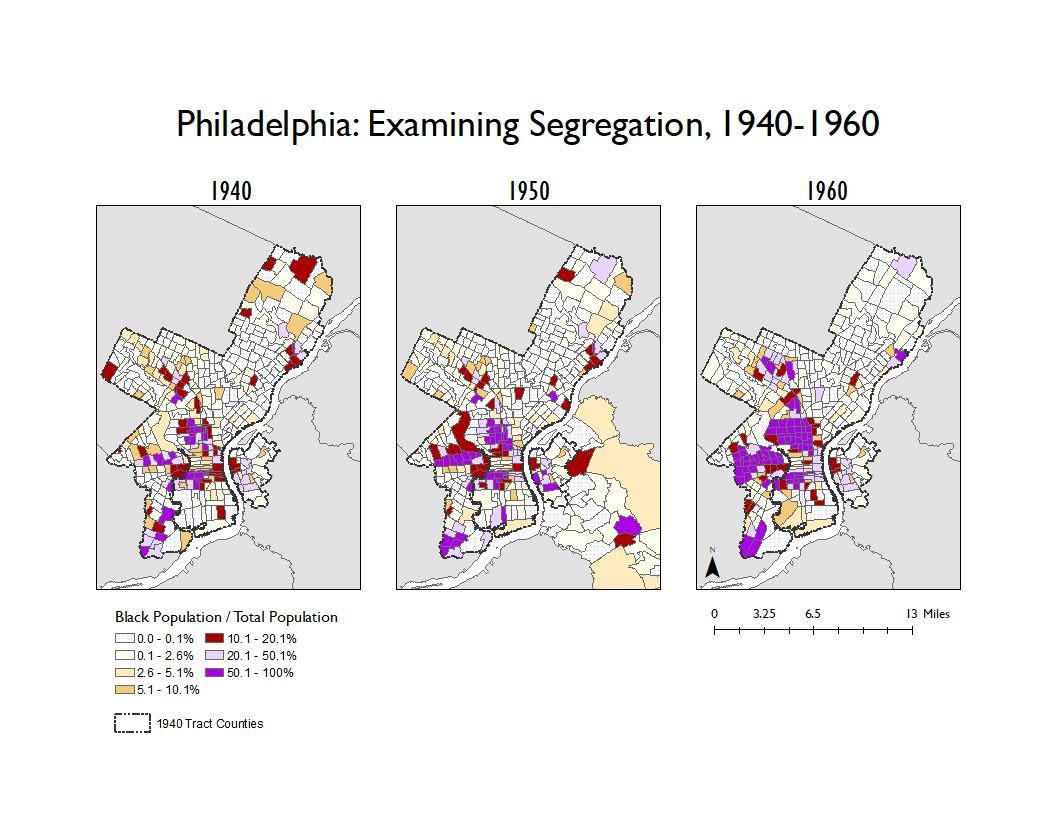
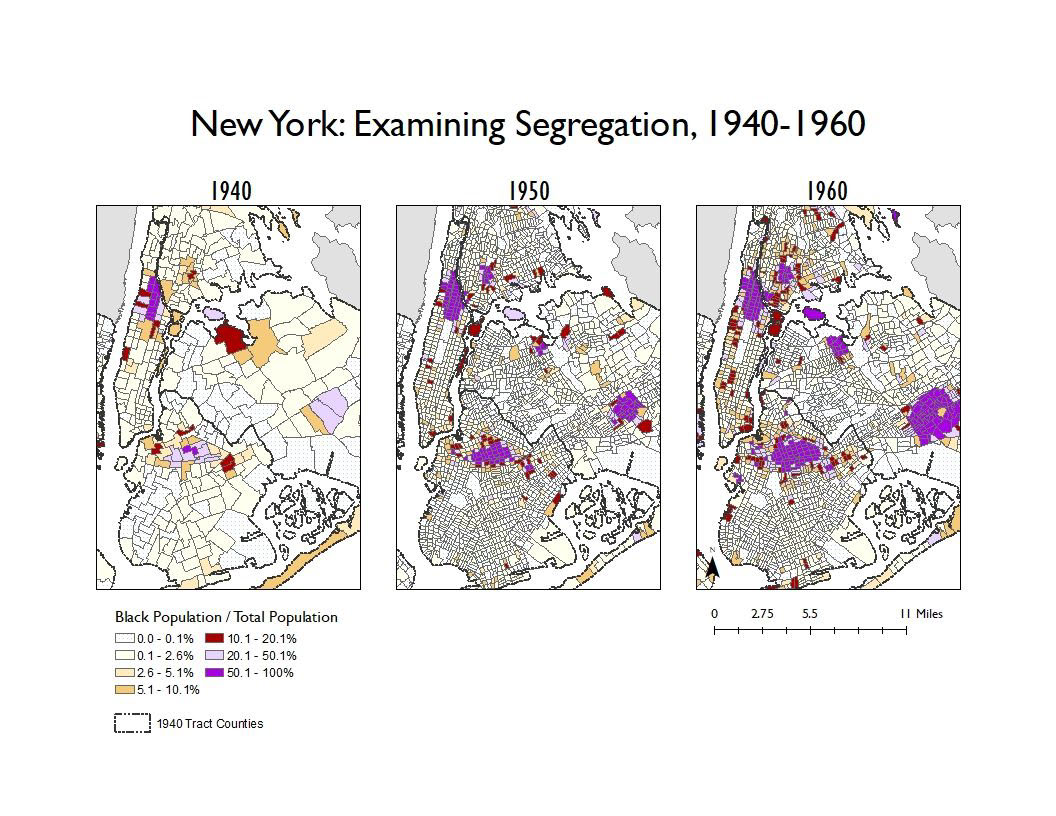
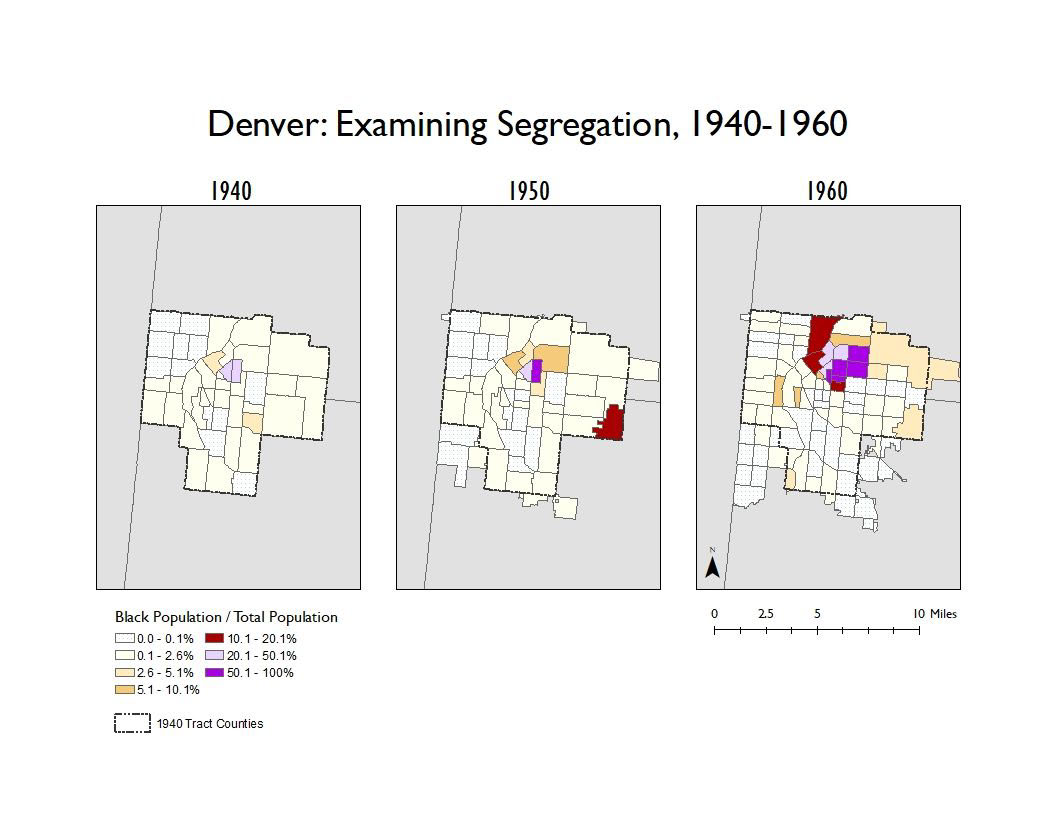
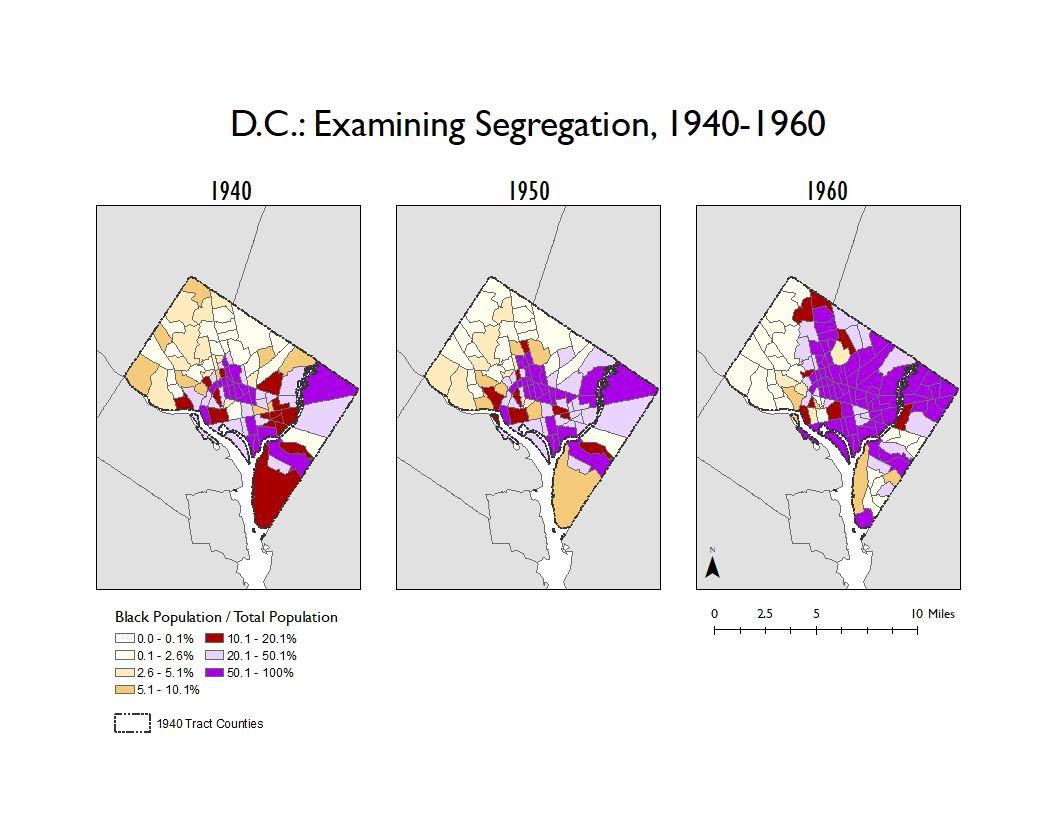
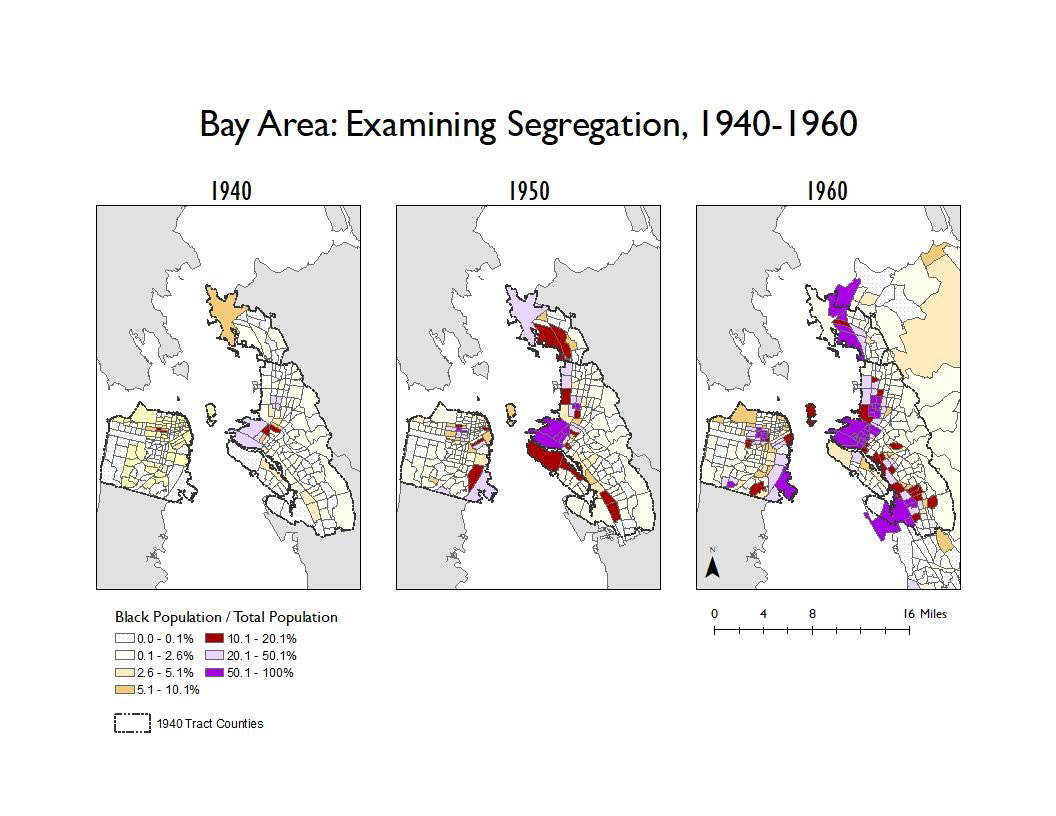
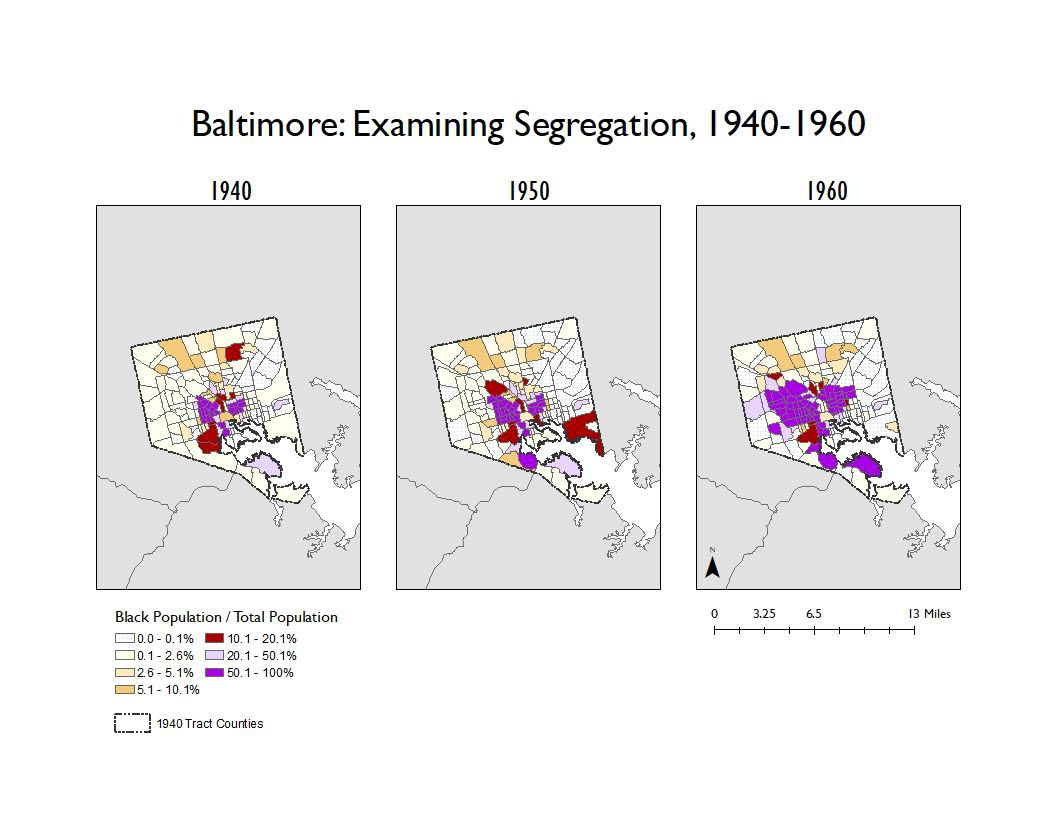
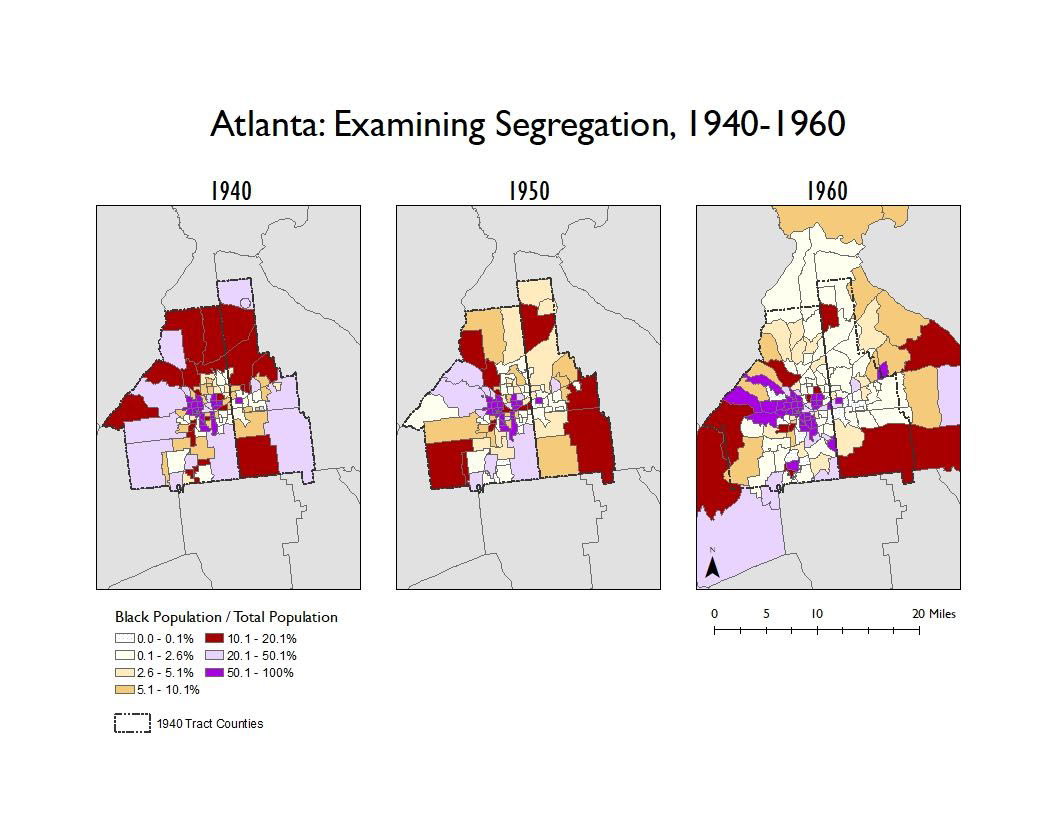
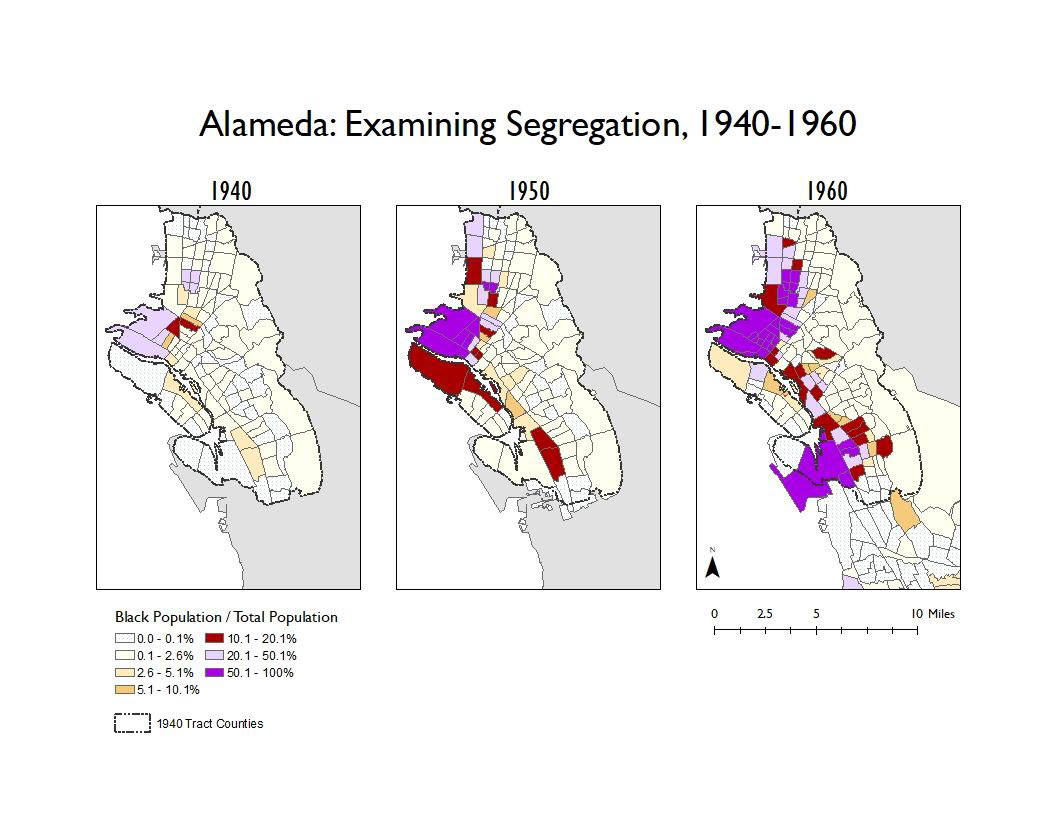
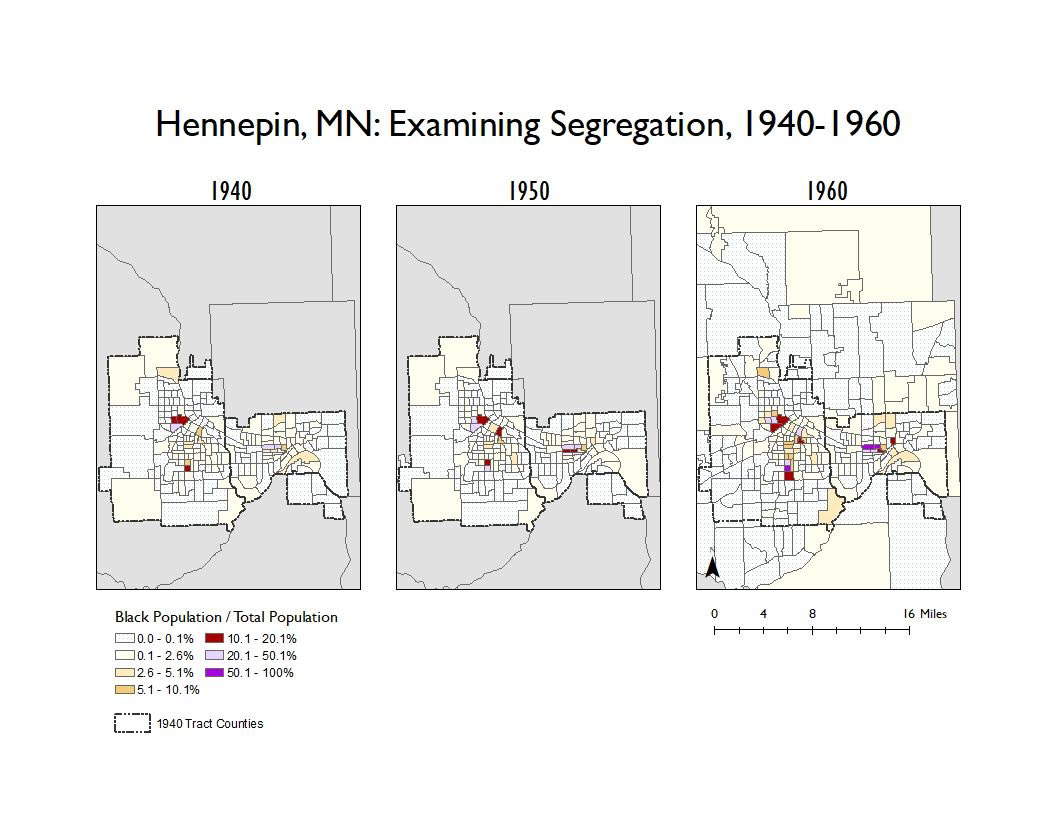
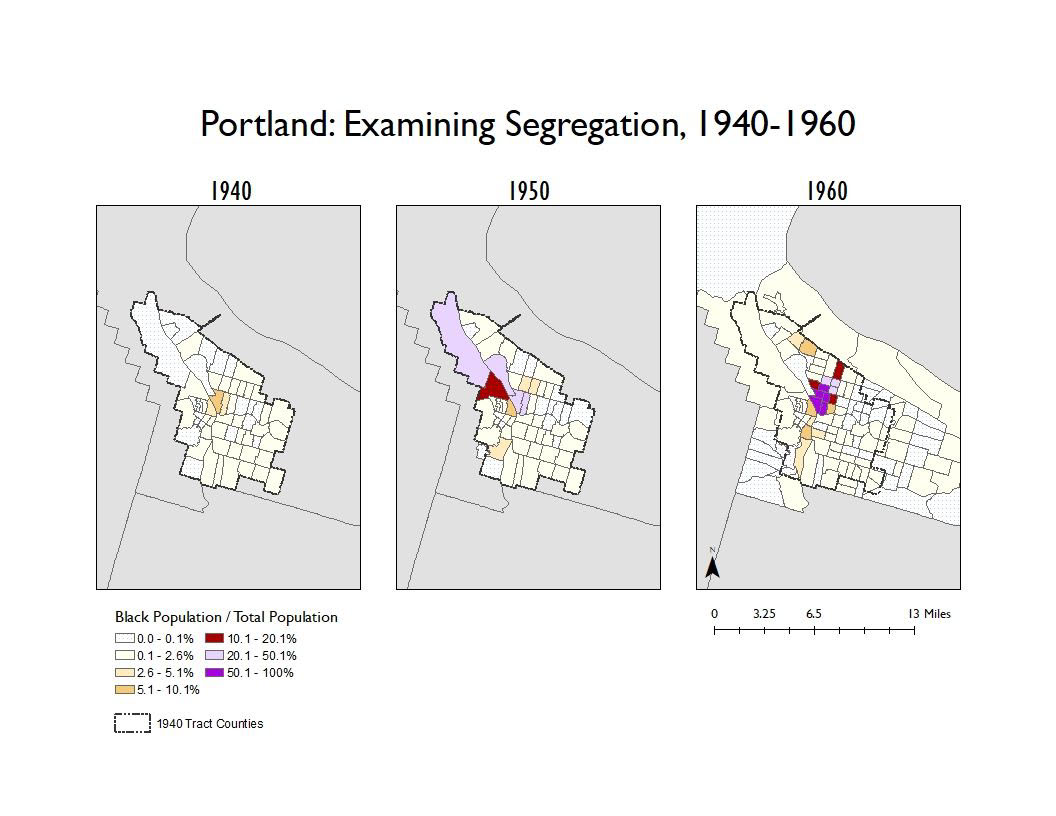
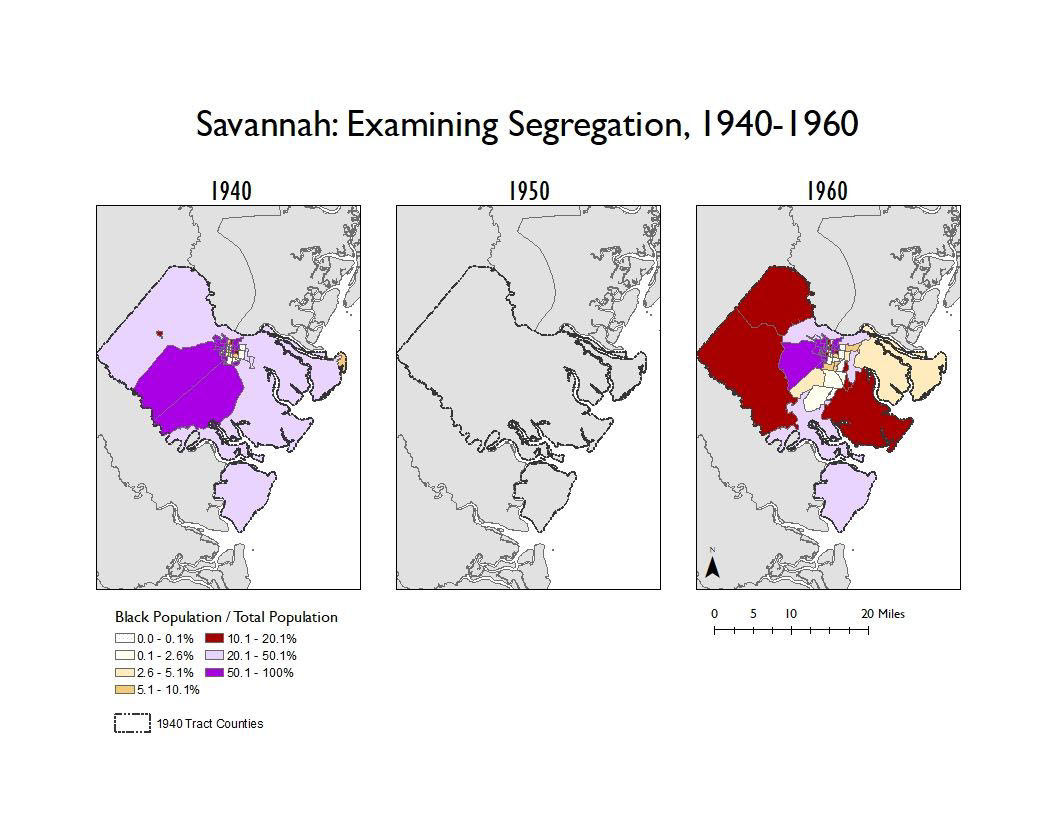
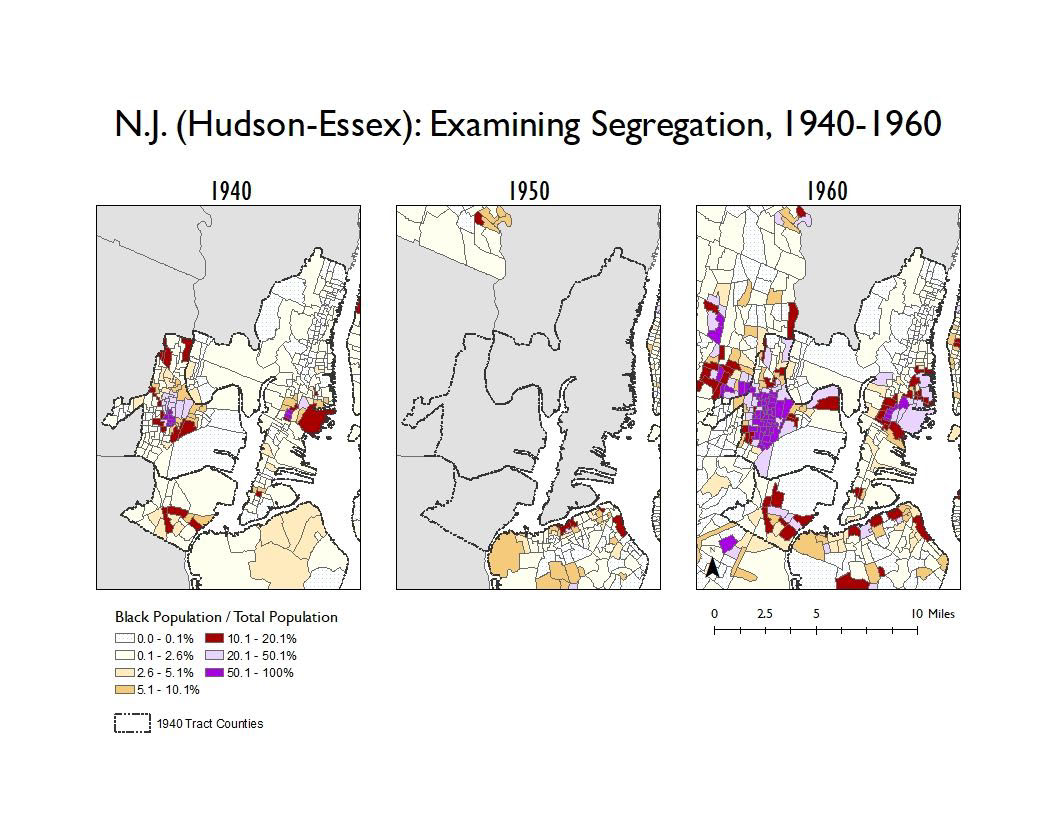
Computation Analysis: The maps below are based upon a simple computation: black population / total population. With this method the change over time is visually evident, but is not quantified. More advanced mapping / analysis of racial change over time is made challenging by the fact that geographic census areas may be redefined in any 10-year period (e.g., city boundaries expand). Different interpolation tools may be applied in ArcMap to address these challenges, although outside of the scope of our preliminary data review.
NOTE: In three of the attached maps, shapefiles did not properly display due to a print error (Hudson-Essex, Savannah, Trenton).
Joining Historic Census Data to Shapefiles: As with modern data acquired directly from the US Census, the tabulations from NHGIS must be joined to shapefiles for each corresponding year (historical derivations of TIGER data). The reason for this is that geographic bounds of census areas (e.g., tracts & blocks) change over time.
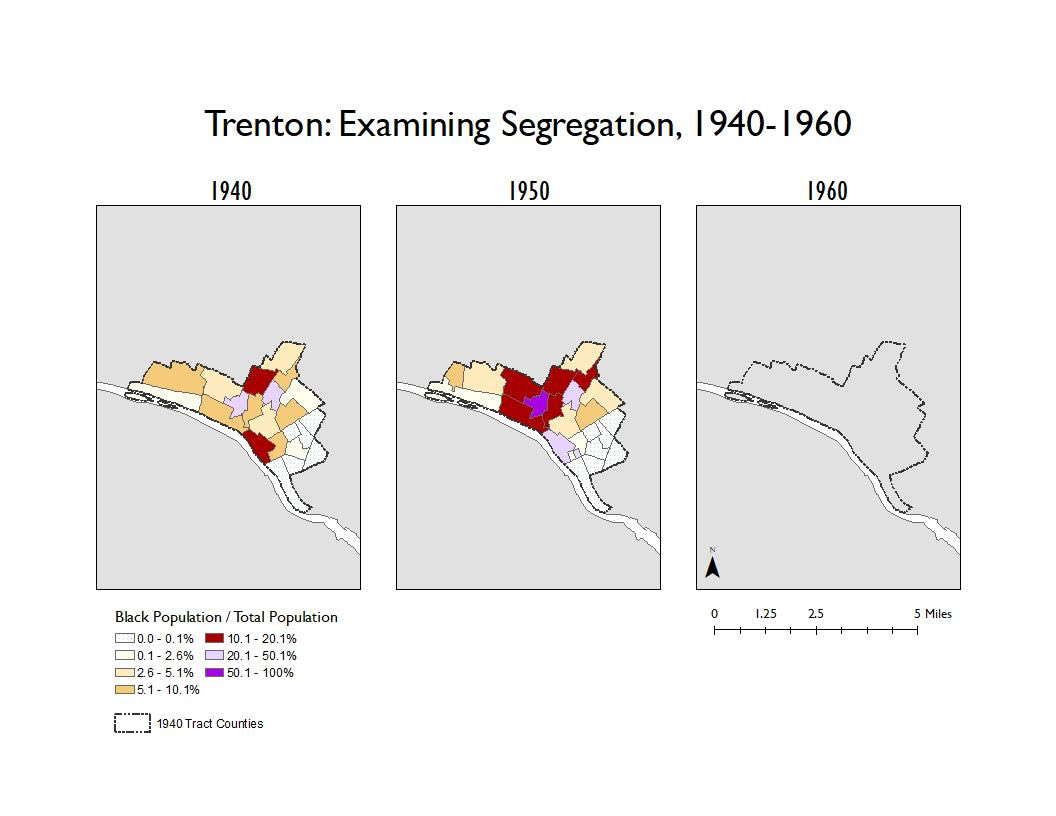
Computation Analysis: The maps above are based upon a simple computation: black population / total population. With this method the change over time is visually evident, but is not quantified. More advanced mapping / analysis of racial change over time is made challenging by the fact that geographic census areas may be redefined in any 10-year period (e.g., city boundaries expand). Different interpolation tools may be applied in ArcMap to address these challenges, although outside of the scope of our preliminary data review.
NOTE: In three of the attached maps, shapefiles did not properly display due to a print error (Hudson-Essex, Savannah, Trenton).
This project involved research into the development of caselaw on racially restrictive covenants (RRCs) in Los Angeles, California. Maps by Jerry Dinzes